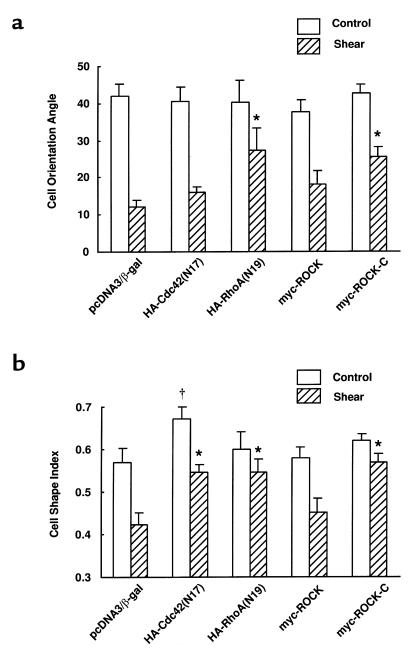
Figure 7.
Summary of results on the cell orientation angles and cell shape indexes from specimens exemplified in Figures 5 and 6. Two hundred transfected cells, identified by the β-gal–, HA-, or myc-positive staining and selected from at least three independent experiments, were subjected to analysis of the cell orientation angle (the angle between the cell principal axis and the flow direction) and cell shape index (4π × cell area)/(cell perimeter squared). Bars represent mean ± SEM. Significant differences (P < 0.05) are indicated by the dagger for static conditions and by asterisks for sheared cells compared with pcDNA3-transfected cells.

