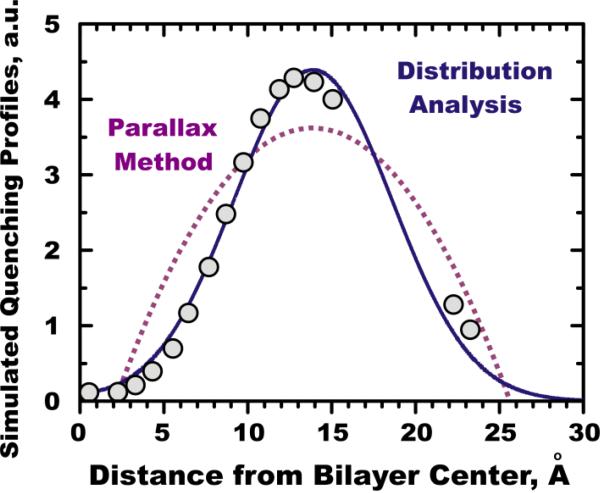
Figure 4.
Comparison of the two main methods of the DDFQ analysis using idealized MD-simulated quenching data of TOE in POPC bilayer. Depth-overlap probability integrals were calculated between TOE's indole fluorophore and each of the 16 carbon “pseudo quencher” atoms of POPC (circles). Solid line represents DA's fit with Equation 1 and dotted line represents fit with the basic equation of the PM (for further details see text and (5)).

