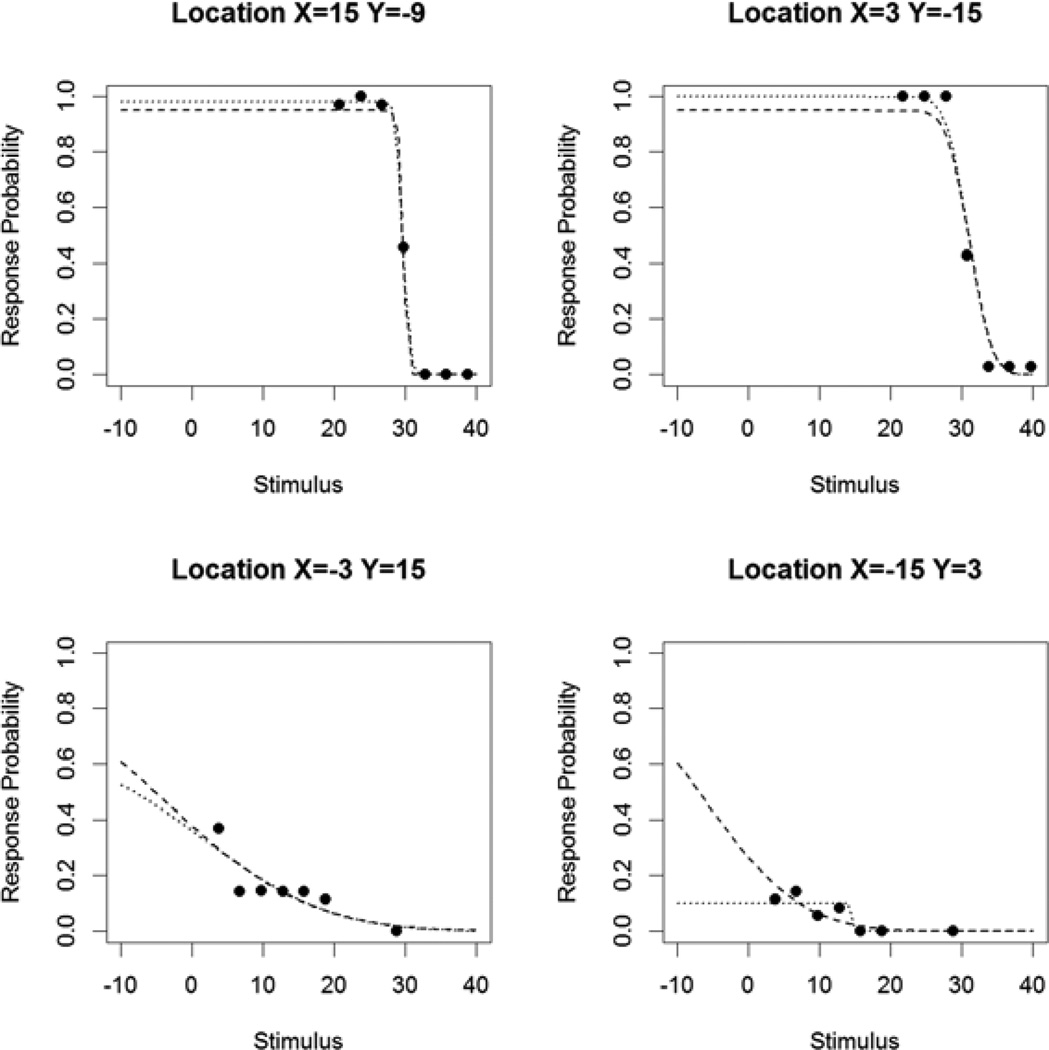
Figure 1.
Response probabilities for a sample study subject, at four tested locations (at positions as labeled in degrees). The dashed curve indicates the Frequency-of-Seeing (FOS) curve as fitted using the primary analysis, in which the maximum response probability would be 95% if contrast could be made sufficiently high (assuming a 5% false negative rate). The dotted curve indicates the FOS curve fit allowing this asymptotic maximum to vary, as in the secondary analysis described in the Methods section.

