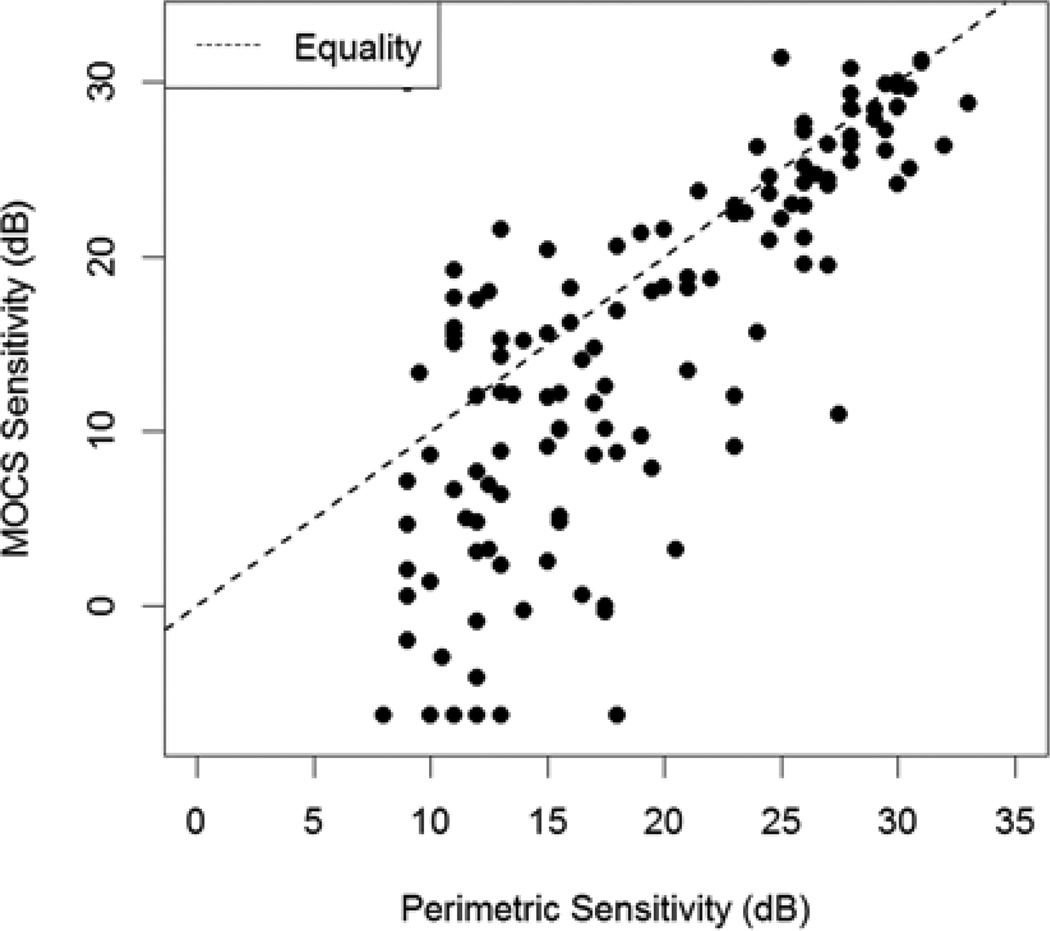
Figure 2.
Sensitivities at each location measured using the Method of Constant Stimuli (MOCS) plotted against the mean of the last two sensitivities measured in clinic using perimetry. Below around 15–19dB, the spread of the data increases markedly, and perimetry tends to overestimate the sensitivity by a seemingly random amount.

