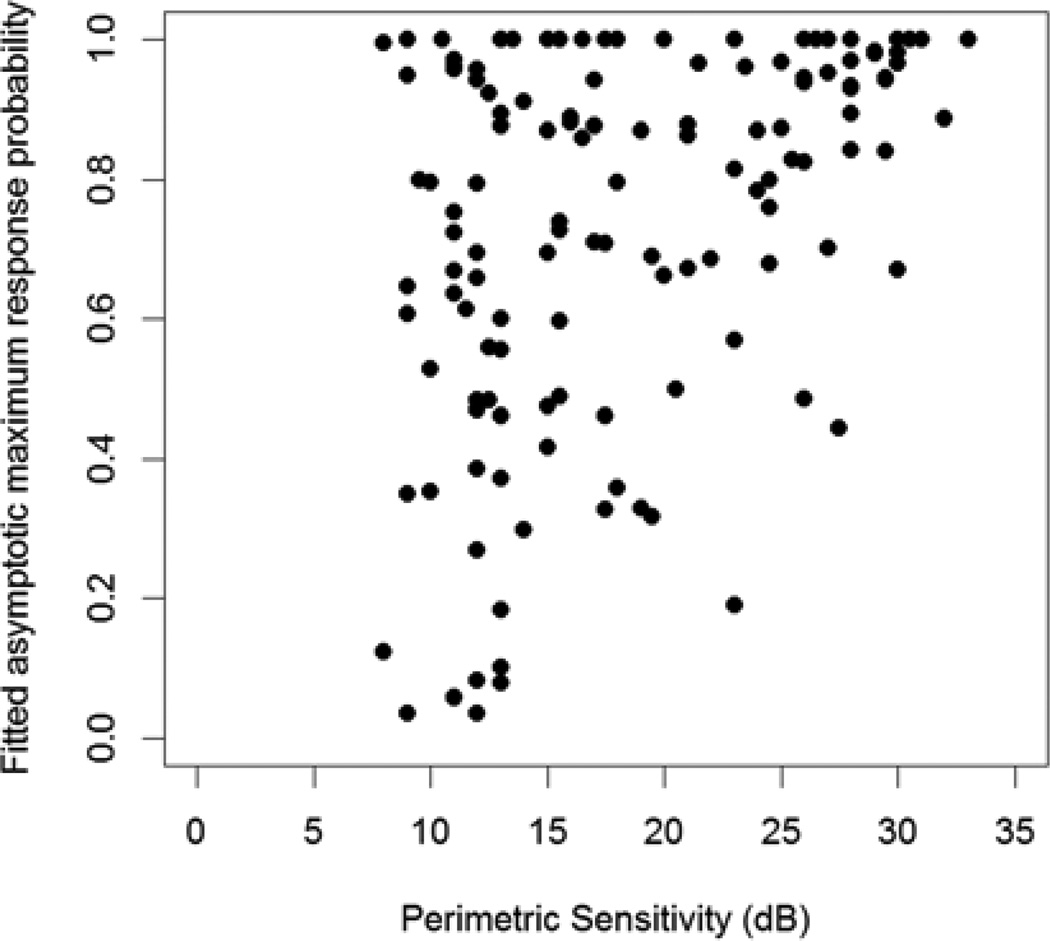
Figure 4.
The probability that the study subject responded to the most intense stimulus (3.7dB) at each of the two most damaged locations tested, plotted against the mean of the last two sensitivities measured in clinic using perimetry. A response probability <50% indicates that the sensitivity is likely lower than 3.7dB.

