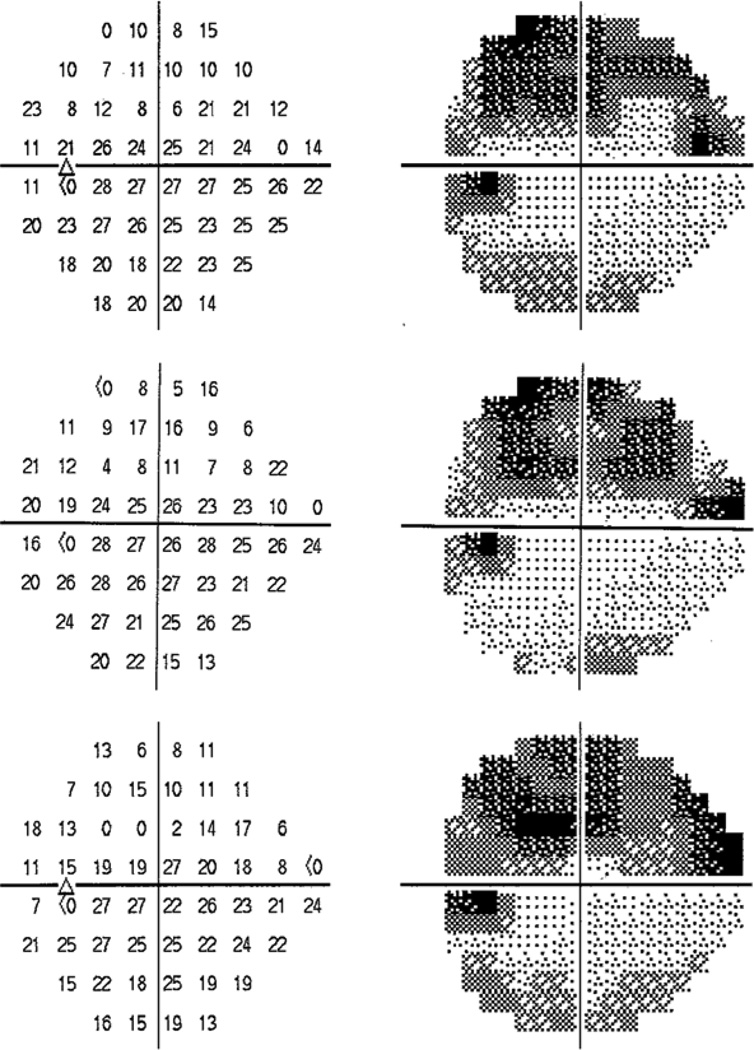
Figure 5.
The asymptotic maximum response probability, fit as a free parameter in the maximum likelihood regression model, plotted against the mean of the last two sensitivities measured in clinic using perimetry. At low sensitivities, the response probability never approaches 100%, indicating response saturation and introducing randomness to perimetric sensitivities.

