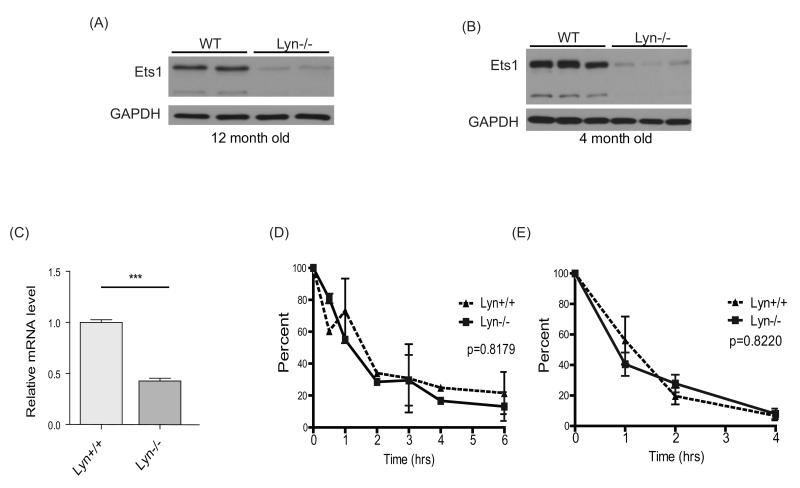
Figure 2. Lyn regulates Ets1 levels in B cells.
(A) Western blot analysis of splenic B cell lysates from two wild-type and two Lyn-deficient mice at (A) 12 months of age or (B) 4 months of age shows downregulation of the two most predominant isoforms of Ets1, the p54 and p42 isoforms, in Lyn−/− cells. Nine separate Western blots for Ets1 were done and included 18 wild-type and 15 Lyn−/− mice analyzed at ages between 1-12 months. (C) RT-qPCR analysis of Ets1 mRNA in B cells from wild-type (Lyn+/+, n=7) and Lyn−/− (n=6) mice. ***p< 0.001 (D) Wild-type (WT) or Lyn−/− splenic B cells were treated with cycloheximide for various times to inhibit protein synthesis and Western blot was performed to measure the levels of Ets1 protein. GAPDH was used as loading control, as it has been reported to have a long half-life (85), and its levels were not changed during the treatment time. Average values of three independent experiments are shown as the quantified ratio of the major p54 isoform of Ets1 to the levels of GAPDH, normalized to the levels at time 0. (E) Equal numbers of B cells from each genotype were treated with actinomycin D for various times to suppress mRNA transcription. Ets1 mRNA levels were measured by RT-qPCR and normalized by the level at time 0. Data represent quantitation of both major RNA isoforms of Ets1 (encoding the p54 and p42 variants of the protein) from three independent experiments. No differences were observed when independently calculating the half-life of each separate isoform.

