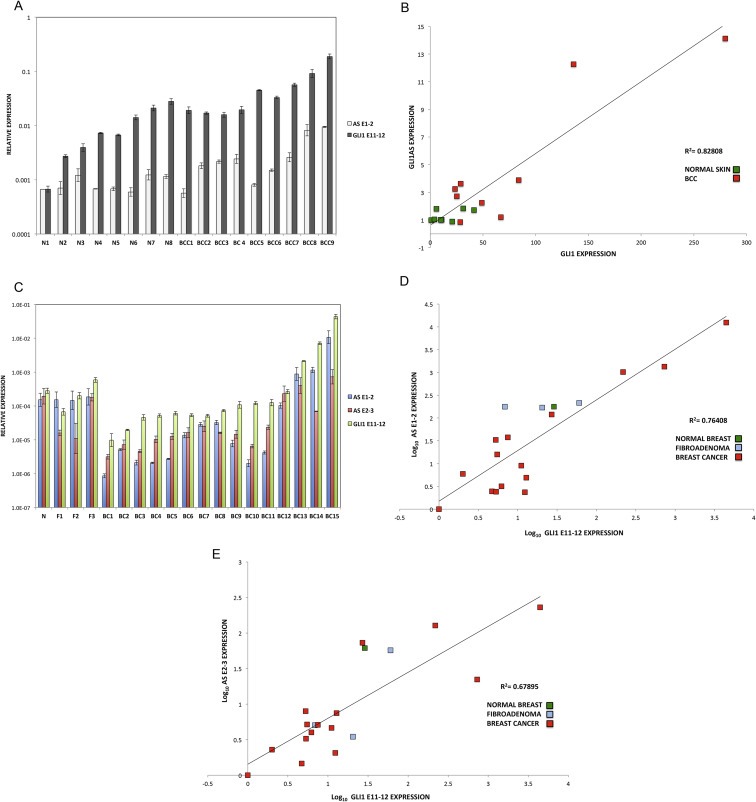
Figure 2.

Expression of GLI1AS in basal cell carcinoma and breast cancer. Co‐regulation with GLI1. A. Real‐time RT/PCR analysis of the expression of GLI1AS and GLI1 in basal cell carcinoma and normal skin. Data are represented as relative expression (2−ΔCt values), calculated by subtracting the mean Ct value of the housekeeping gene RPLPO from the Ct value of the GLI1 and GLI1AS transcripts (ΔCt). B. Co‐relation of GLI1AS with GLI1 expression in basal cell carcinoma and normal skin. The expression of GLI1AS and GLI1 in the eight normal skin and the nine basal cell carcinoma samples determined above was normalized to the expression in the skin sample with lowest GLI1 expression, by subtracting the ΔCt value of this sample from the ΔCt in all samples, resulting in ΔΔCt values. Data are presented as normalized relative expression (2−ΔΔCt values). A positive correlation was observed between GLI1 and GLI1AS expression, R2 = 0.82808 (Pearson correlation = 0.91, P < 0.05). C. Real‐time RT/PCR analysis of the expression of GLI1AS and GLI1 in breast cancer, benign fibroadenoma and normal breast samples. Data are represented as relative expression (2−ΔCt values), calculated by subtracting the Ct value of the housekeeping gene ACTB from the Ct value of the GLI1 and GLI1AS (AS E1‐2 and AS E2‐3) transcripts (ΔCt). D, E. Co‐relation of GLI1AS with GLI1 expression in breast cancer. The expression of GLI1AS and GLI1 in the 15 breast tumor samples, the three benign fibroadenomas and the normal breast sample determined above was normalized to the expression of the least expressing sample (BC1), by subtracting the ΔCt in BC1 from the ΔCt in all samples, resulting in ΔΔCt values. Data are presented as the Log10 of the 2−ΔΔCt values. A positive correlation was observed between GLI1 (GLI1 E11‐12) and GLI1AS (AS E1‐2, D or AS E2‐3, E) expression, R2 = 0.76408 (Pearson correlation = 0.874, P < 0.05) or 0.67895 (Pearson correlation = 0.824, P < 0.05), respectively.
