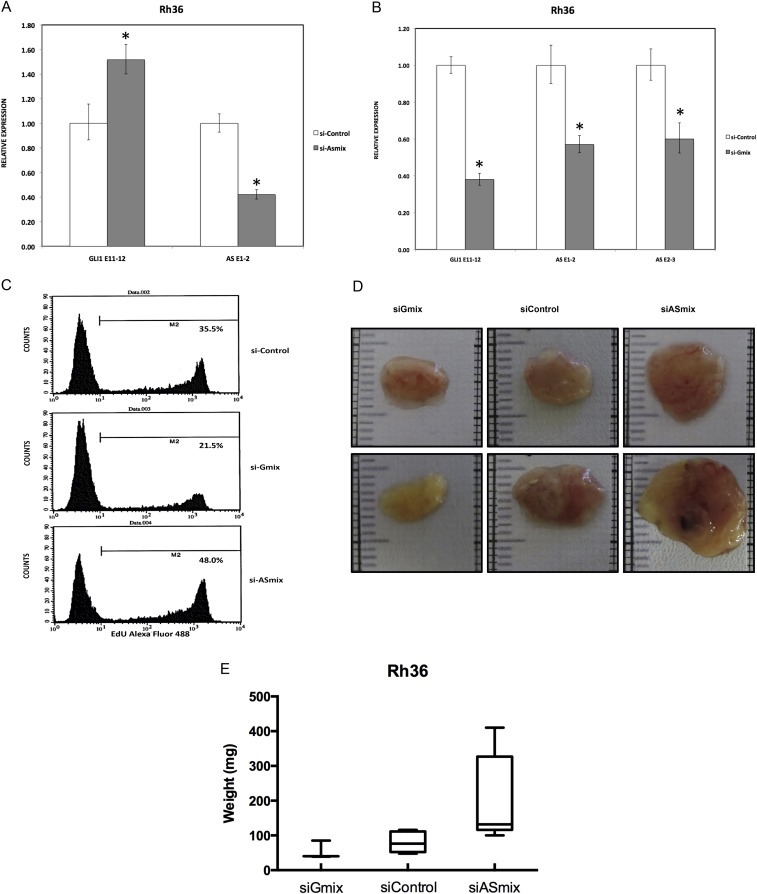
Figure 3.

GLI1AS knockdown increases GLI1 expression in the Rh36 cell line. A. Real‐time RT/PCR analysis of the expression of GLI1 and GLI1AS transcripts in Rh36 cells, following knockdown of GLI1AS by a 48‐h treatment with si‐ASmix, respectively. Data are represented as relative expression (2−ΔΔCt values), calculated by subtracting the Ct value of the housekeeping gene TBP from the Ct value of the GLI1 and GLI1AS transcripts (ΔCt), and normalized to the ΔCt value obtained by a control siRNA (si‐Control), by subtracting this control ΔCt value from the ΔCt values of the si‐Gmix and si‐ASmix samples (ΔΔCt). Error bars indicate the standard deviation. *, Statistical significant, P < 0.01 compared to control, calculated by the Student's t‐test. B. The expression of GLI1 and GLI1AS transcripts in Rh36 cells, following knockdown of GLI1 by a 48‐h treatment with si‐Gmix was analyzed as in (A). Note that siRNA treatment effectively reduced expression of the targeted genes. Additionally, the si‐ASmix increased the GLI1 mRNA (GLI1 E11‐12) while the si‐Gmix conferred a decrease in GLI1AS (AS E1‐2 and AS E2‐3). C. Rh36 cells, cultured for 48 h after transfection with si‐Control, si‐Gmix or si‐ASmix, were subjected to the EdU incorporation assay for 4 h. The percentage of cells labeled with Alexa Fluor 488 azide and detected by flow cytometry is shown. Note that treatment with the si‐Gmix reduces proliferation, while treatment the si‐ASmix increases proliferation, in‐line with the changes in GLI1 mRNA levels. D, E. Rh36 cells, cultured for 48 h after transfection with si‐Control, si‐Gmix or si‐ASmix were introduced onto the chorioallantoic membrane of fertilized chicken eggs (CAM assay) and tumors were collected after 10 days. Two representative tumors from each experimental treatment are shown in D. Tumor weights (in mg), from three independent experiments, are represented as box plots, with the box denoting median ± interquartile range (IQR) and the whiskers the range from minimum to maximum, shown in E.
