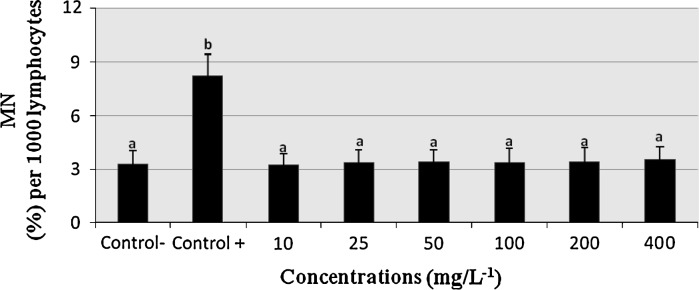
Fig. 2.

The percentages of micronucleus (%) in cultured human lymphocytes exposed to various concentrations of COP. MN Micronucleus; Control− negative control; Control+ positive control; (mitomycin C: 10−7 M). The bars marked by different letter are different from each other at a level of 0.05
