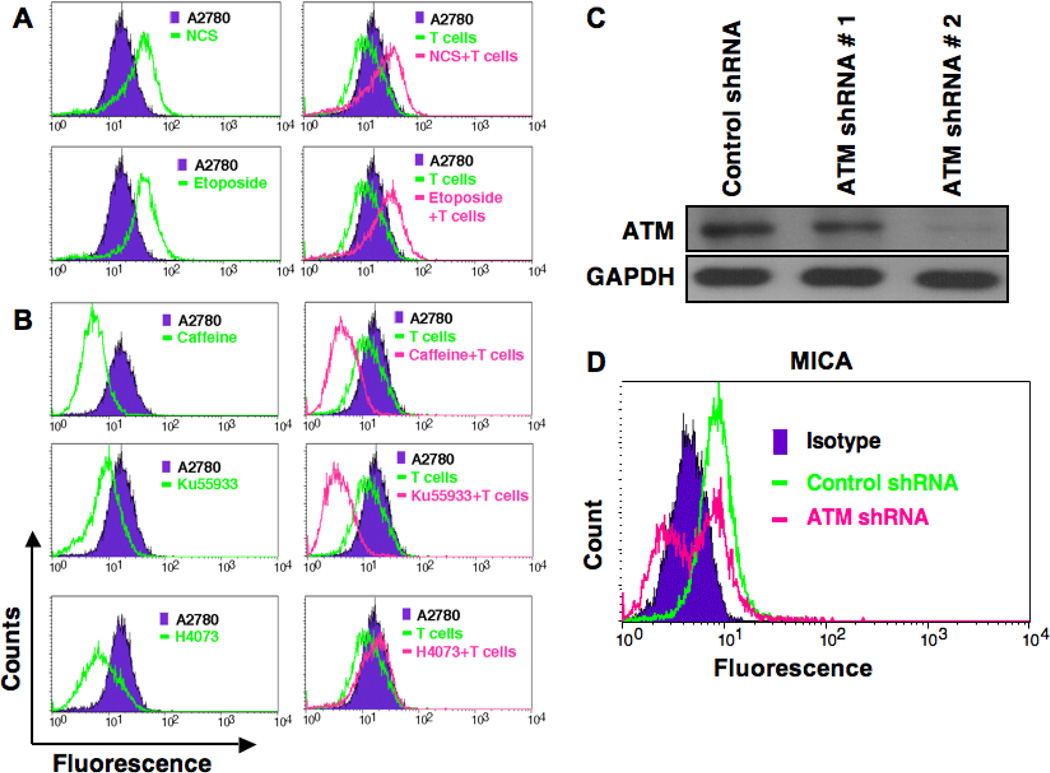
Figure 5. ATM-inducing molecule enhances surface expression of MICA in ovarian cancer cells and ATM-inhibitor reduces it.
A. Ovarian cancer cells were co-cultured with Vγ2Vδ2 T cells for 24 h at 1:10 ratios in presence or absence of ATM-inducing factors (NCS or etoposide) and assessed for surface expression of MICA level using flowcytometry. Appropriate isotype Ab was used as a control. B. The surface expression of MICA molecule on ovarian cancer cells was also assessed by flowcytometry in presence or absence of Vγ2Vδ2 T cells and ATM-inhibiting factors (caffeine or Ku55933). C. ATM knock down in A2780 cells was evaluated by WB methods. Upper panel shows level of ATM and lower panel shows level of internal control GAPDH. D. Flowcytometric analysis for MICA. ATM knocked down cells was subjected to flowcytometric analysis for surface expression of MICA molecule.

