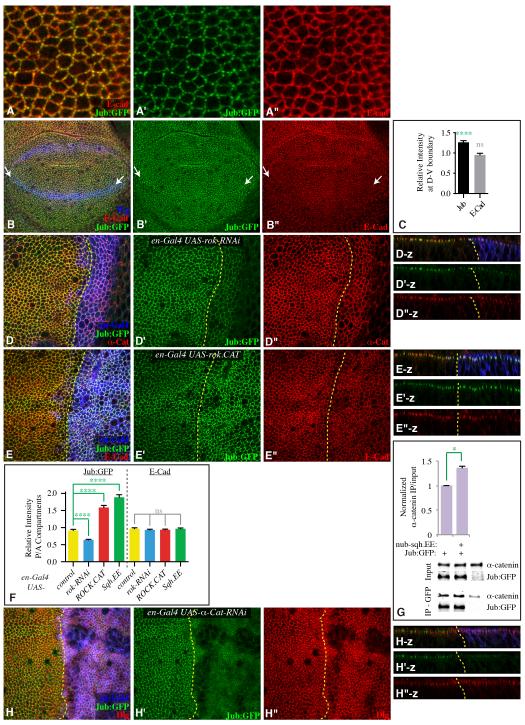
Figure 6. Apical localization of Jub is promoted by cytoskeletal tension.
A,B,D,E,H) Third instar wing discs expressing Jub:GFP (green), and stained for expression of E-cad, α-cat, or Dlg (red), as indicated. A) High magnification view showing Jub:GFP puncta along cell junctions. B) Mid third instar disc, with D-V compartment boundary marked by arrows. Wg (blue) marks the D-V boundary and proximal wing. C) Quantitation of Jub:GFP and E-cad along the D-V compartment boundary in early to mid third instar, presented as the ratio of junctional staining along the boundary compared to random cell junctions (N=13 pairs of measurements). D, E) en-Gal4 UAS-dcr2 UAS-RFP (blue) and D) UAS-rok-RNAi or E) UAS-rok.CAT. Panels to the right (-z) show vertical sections. F) Quantitation of Jub:GFP and E-cad at adherens junctions in discs of en-Gal4 UAS-dcr2 UAS-RFP plus, where indicated, UAS-rok-RNAi, UAS-rok.CAT or UAS-sqh.EE, represented as the mean intensity of junctional fluorescence in P compartment regions divided by the mean intensity in A compartment regions (N=12(wild type), 32(rok RNAi), 30(ROCK.CAT), 25(Sqh.EE)). G) Western blots and quantitation of co-precipitation of α-catenin with Jub:GFP from third instar wing disc lysates (200 discs per lane). Lysates were made on discs dissected from nub-Gal4 Jub:GFP, nub-Gal4 Jub:GFP UAS-sqh.EE, or w-. Upper two panels show amounts in lysates (Input), lower two panels show amounts precipitated by GFP-TrapA beads. Some non-specific precipitation of α-catenin occurs, but precipitation from animals expressing Jub:GFP is consistently greater. Histogram shows the average ratio of α-catenin in IP over that in input after background subtraction from three biological replicates, normalized to the ratio in nub-Gal4 Jub:GFP. For both input and IP blots, the level of α-catenin was normalized to the Jub:GFP level. H) en-Gal4 UAS-dcr2 UAS-RFP (blue) UAS-α-cat-RNAi. Panels to the right (-z) show vertical sections. Yellow dashed lines mark the A-P compartment boundary. Error bars show sem. See also Fig. S5.

