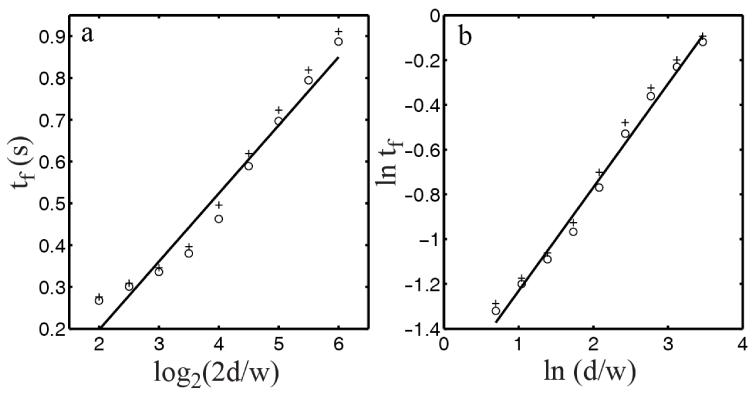
Fig. 6.
Log and power forms of Fitts’s law. Circles and crosses represent movement times (tf) calculated from the model with target widths of 0.04 and 0.02 m, respectively, and various distances (see text). (a) tf is plotted as a function of log2(2d/w). The log Fitts law predicts a straight line. (b) ln tf is plotted as a function of ln(d/w). The power Fitts law predicts a straight line. In each panel, linear fit of the circles, not crosses, is shown. The power index, given by the slope of the line in panel b, is 0.46.

