Figure 3.

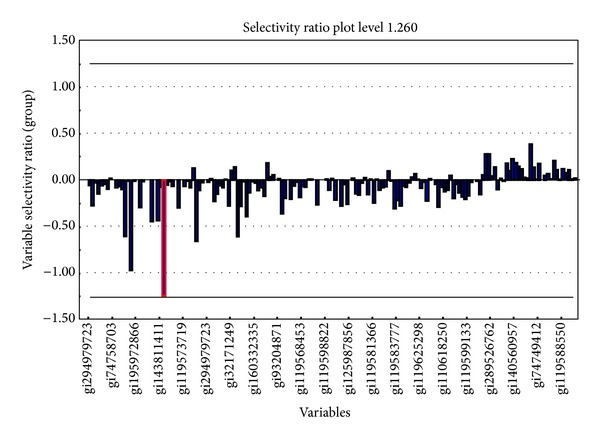
Selectivity ratio plot for all identified proteins. The selectivity ratio limit for a 90% mean corrected classification rate is shown as horizontal lines. The zinc finger protein 441 is marked with red square box.

Selectivity ratio plot for all identified proteins. The selectivity ratio limit for a 90% mean corrected classification rate is shown as horizontal lines. The zinc finger protein 441 is marked with red square box.