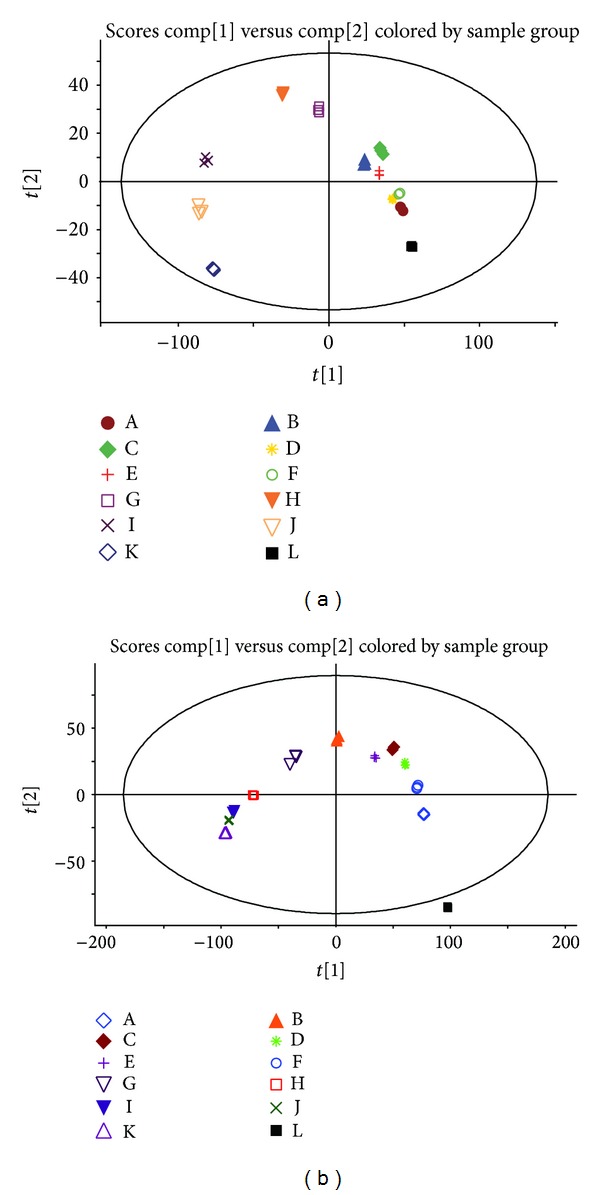
Figure 3.

BBThe OPLS-DA score plot of 36 samples obtained using Pareto scaling with mean centering. (a) Positive ion mode. (b) Negative ion mode. The same score plots represent the same group. Both the positive and negative ion modes showed that the samples were clearly clustered into 12 groups. Replicates of the 12 groups could be distinguished easily.
