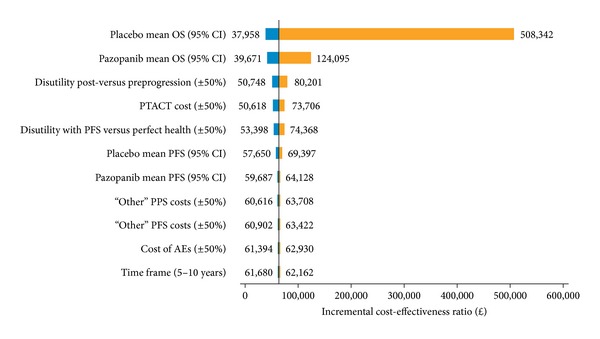
Figure 2.

Tornado diagram showing result of deterministic sensitivity analysis for the direct comparison of cost-effectiveness of pazopanib versus placebo. Parameters were varied by 0.5 or 1.5 and shown on either side of the graph. AE: adverse events; CI: confidence interval; OS: overall survival; PFS: progression-free survival; PPS: postprogression survival; PTACT: posttreatment anticancer therapy.
