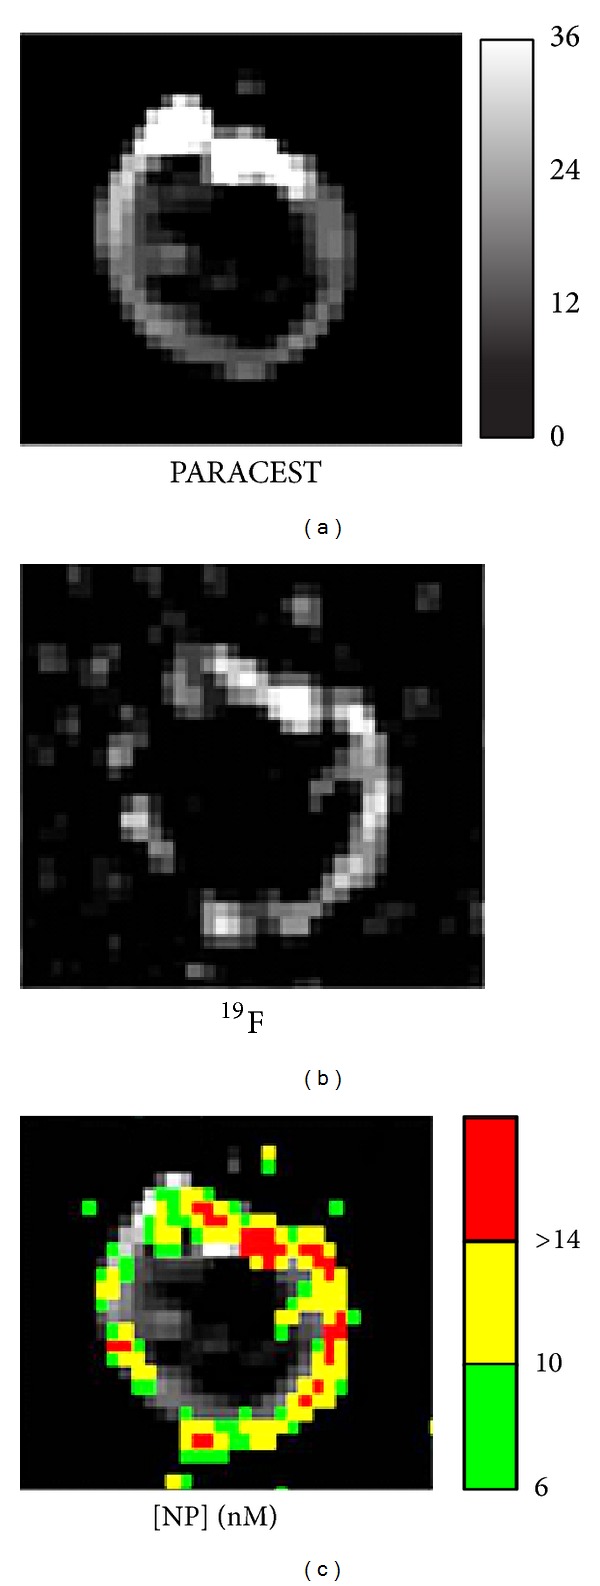
Figure 3.

Dual PARACEST and fluorine MRI of fibrin targeted PARACEST perfluorocarbon nanoparticles bound to the surface of a clot. The PARACEST contrast to noise ratio map (a) and fluorine image (b) both show nanoparticles bound to the surface of the clot. The fluorine signal intensity was calibrated to measure the nanoparticle concentration on the clot surface in nM. The particle concentration map is color-coded and overlaid onto the PARACEST subtraction image (c), demonstrating colocalization of these two definitive signals and allowing the water exchange kinetics to be estimated after binding to a biological target. Reprinted with permission from [57].
