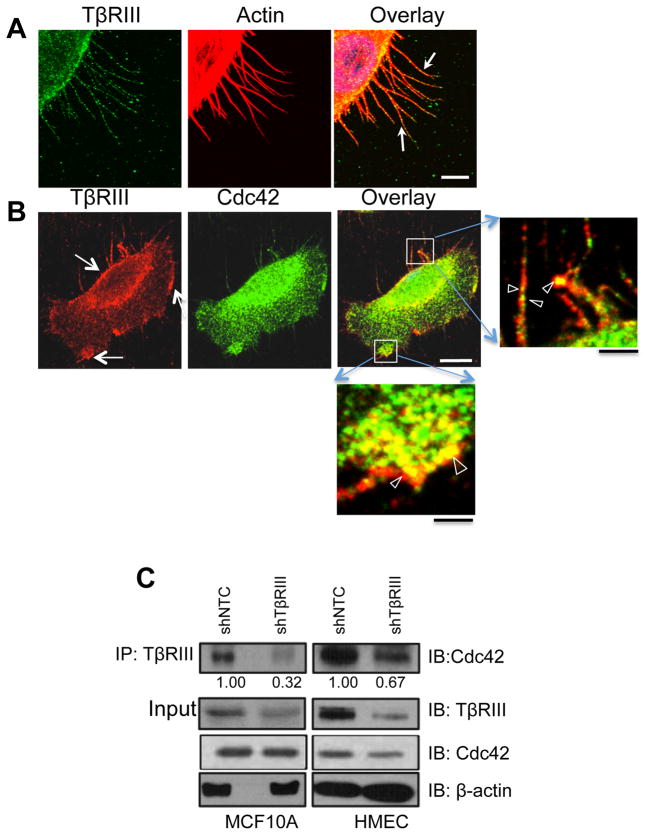
Figure 3. Cell surface TβRIII interacts with and colocalizes with Cdc42 at the cell edge and on filopodial structures.
Confocal images of sub-confluent MCF10A cells serum starved for 14 hours before fixation and staining for (A) endogenous TβRIII (green) or actin (red) using phalloidin. Arrows indicate representative points of punctate localization of TβRIII at filopodial structures and at the base of filopodia. Bar=10μm or (B) endogenous TβRIII (red) and endogenous Cdc42 (green) were labeled using antibody to TβRIII and Cdc42. Closed arrows indicate representative areas where TβRIII and Cdc42 colocalize. Open arrows in magnified areas of boxed regions indicate areas where TβRIII and Cdc42 colocalize. White Bar= 3.3 μm, Black Bar=2.2μm. (C) Indicated MCF10A cells were immunoprecipitated with antibody to TβRIII and immunoblotted with antibody to endogenous Cdc42, with assessment of <5% of the cell lysate for TβRIII and Cdc42. Data are representative of >3 independent experiments. Quantitation relative to total input Cdc42 is presented below the immunoblot.

