Figure 5.
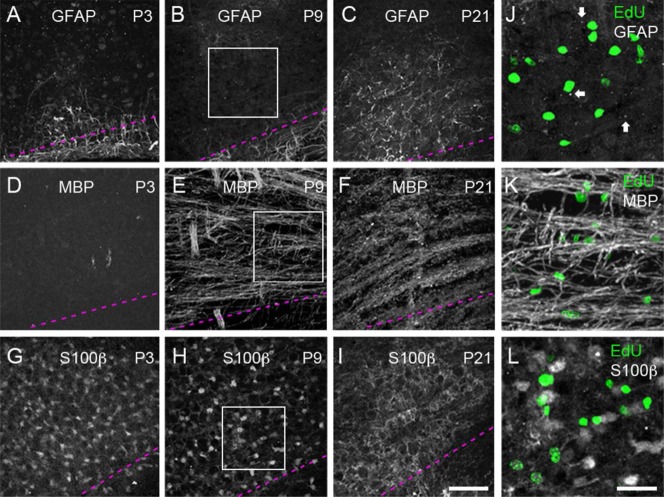
Developmental changes in glial cell marker labeling in the rat MNTB. Immunohistochemistry with anti-GFAP, -MBP, and -S100β antibodies at P3, P9, and P21 (3 pups per age, at least 4 slices per animal). The ventral side of the MNTB is outlined with dashed lines similar to Figure 3C. A,B: GFAP immunohistochemistry at P3 and P9 shows labeled cellular processes near the ventral surface of the brainstem. C: GFAP-labeled processes are present throughout the MNTB at P21. D: MBP immunohistochemistry does not show any labeling at P3. E: MBP immunohistochemistry shows labeled fibers at P9. F: The pattern of anti-MBP staining shows a more compact staining pattern compared to P9. G,H: Anti-S100β immunohistochemistry reveals a pattern of cell bodies and processes throughout the MNTB at P3 and P9. I: Anti-S100β immunohistochemistry labels only cell processes at P21. J–L: Zoom-in views of boxed areas at P9 (panels B,E,H), showing the distribution of EdU-labeled cells (green) with respect to each glial cell marker. Arrows in J indicate small GFAP-labeled particles in the MNTB. GFAP, glial acidic fibrillary protein; MBP, myelin basic protein. Scale bars = 75 μm in I (applies to A–H); 30 μm in L (applies to J,K).

