Figure 6.

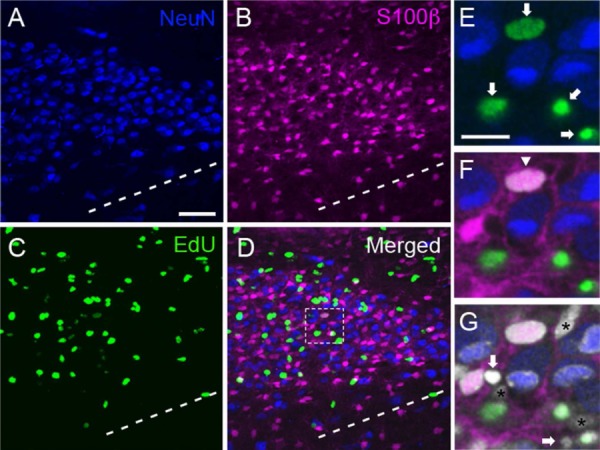
EdU labels putative cell progenitors in the MNTB. A–C: Representative z-stack projection from a P9 rat brain slice triple-stained with NeuN (blue, A), S100β (magenta, B), and EdU (green, C). D: The merged image shows little overlap between the different makers. Dashed line represents the ventral border of the MNTB. E: High-magnification view of a single optical slice from boxed region in (D) showing EdU (green, arrows) and NeuN (blue)-labeled cells. F: The same optical slice from E shows that S100β-labeled cells and their processes (magenta) intercalate between NeuN and EdU-labeled cells. There is one EdU/S100β double-labeled cell in this field of view (downward arrowhead; white shows colocalization). G: DAPI staining reveals several cell nuclei that are not stained by the NeuN, S100β or EdU markers (asterisks), including two DAPI-stained cell nuclei with pyknotic morphology (arrows). Scale bars = 50 μm in A (applies to B–D); 15 μm in E (applies to F,G).
