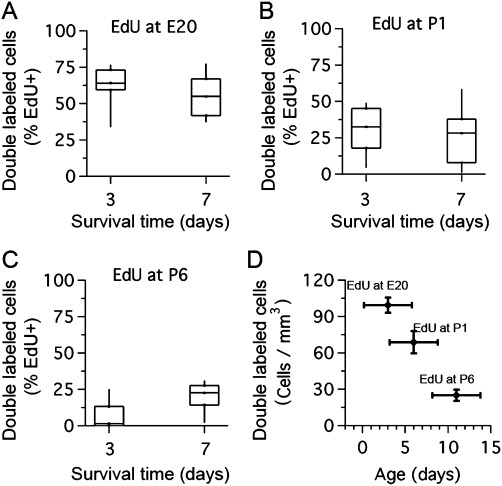
Figure 8.

Differential S100β expression in newly born cells during development. A: Percent of EdU-labeled cells that were double-labeled with S100β immunohistochemistry at 3 and 7 days after EdU injection at E20. B: Percent of EdU-labeled cells that were double-labeled with S100β immunohistochemistry at three and seven days after EdU injection at P1. C: Percent of EdU-labeled cells that were double-labeled with S100β immunohistochemistry at 3 and 7 days after EdU injection at P6. D: Density of double-labeled EdU/S100β cells after EdU injection at different ages (EdU at E20, 6 rats, 34 brain slices; EdU at P1, 8 rats, 40 brain slices; EdU at P6, 5 rats, 61 brain slices; Kruskal–Wallis test, P < 0.0001). Dataset represents mean ± SEM for cell density and mean ± SD for age.
