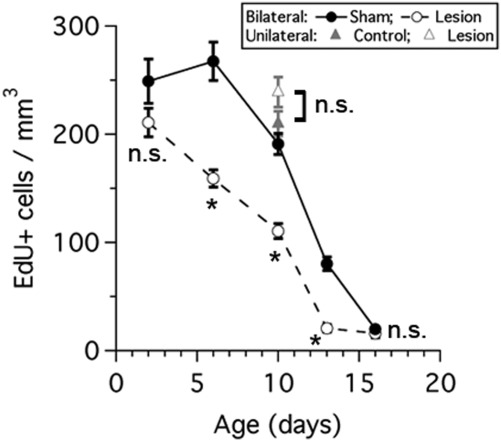
Figure 13.

Auditory periphery lesions result in a decrease in cell proliferation in the rat MNTB. Graph shows the density of EdU-labeled cells in sham (black circles) and bilateral lesioned animals (white circles) at different postnatal ages. Note there is a reduction in cell density values between sham and lesion animals at P6, P10 and P13 (t-test with correction for multiple comparisons, *P < 0.0001). No difference between control (gray triangle) and unilateral lesion (white triangle) cell density values was detected (unpaired two-tailed t-test, P = 0.1219). n.s. = not significant.
