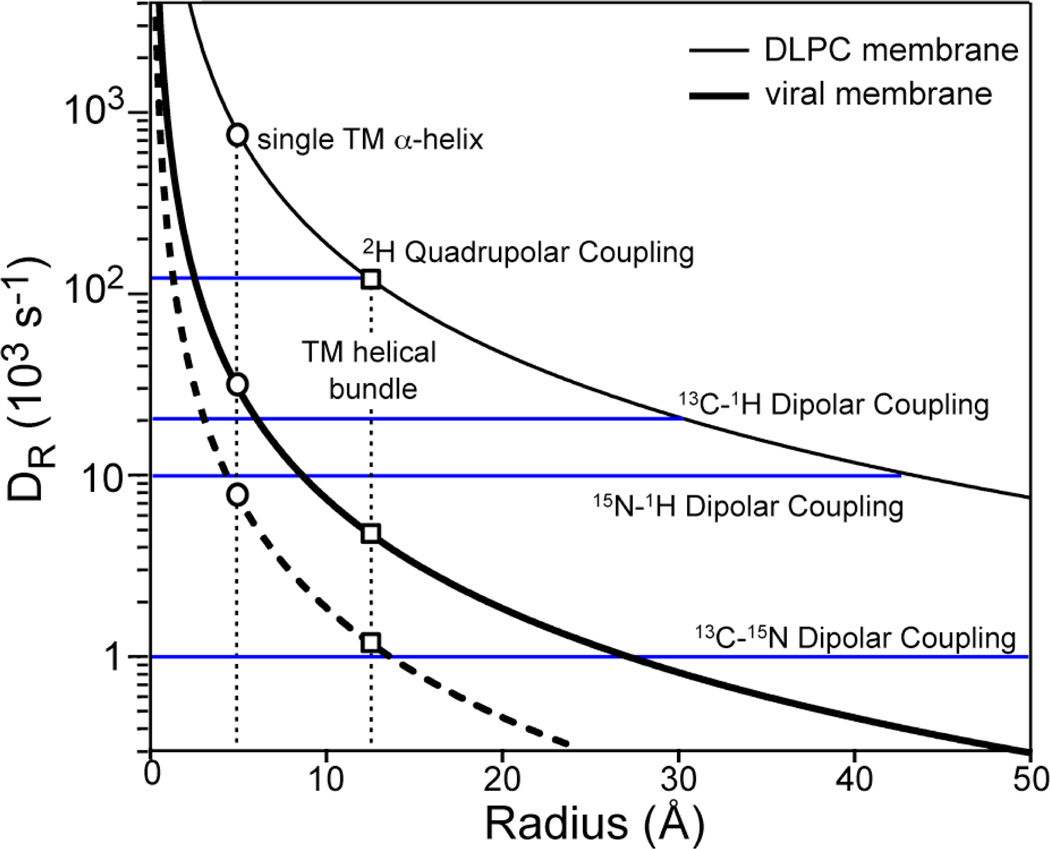
Fig. 1.
Calculated rotational diffusion rates (DR) of membrane proteins in viral membranes (thick line) and DLPC bilayers (thin line) at 298 K. The DLPC curve was calculated with η = 5 poise and h = 35 Å. The viral membrane curve was calculated with η = 100 poise and h = 45 Å. The dashed line was calculated with η = 400 poise and h = 45 Å. The radii of a single TM helix and a TM helical bundle are 5 Å and 12.5 Å, respectively. The sizes of several NMR spin interactions are shown as blue horizontal lines.

