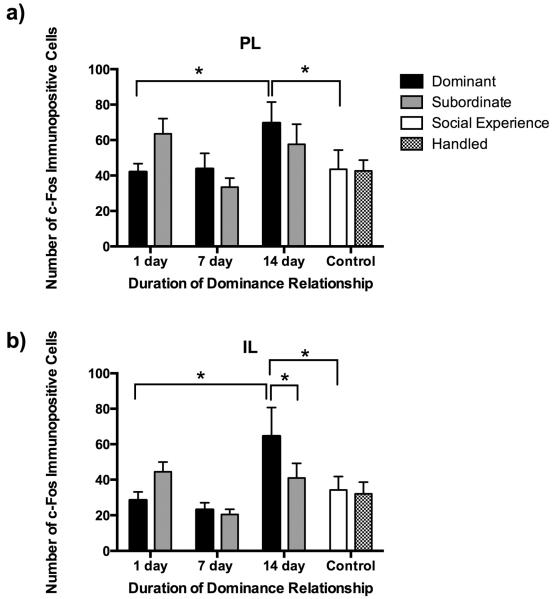
Fig. 4.
Number (mean ± SE) of c-Fos immunopositive cells in subregions of the ventral medial prefrontal cortex measured following social defeat. Dominants (black bars), subordinates (gray bars), and social experience controls (white bars) were exposed to social defeat, whereas handled controls (hatched bars) were not. In the PL (a), there was a main effect of duration of dominance relationship. In the IL (b), there was an interaction between duration of dominance relationship and social status. Post-hoc tests revealed significant differences between bracketed bars represented by an asterisk (*, P < 0.05).

