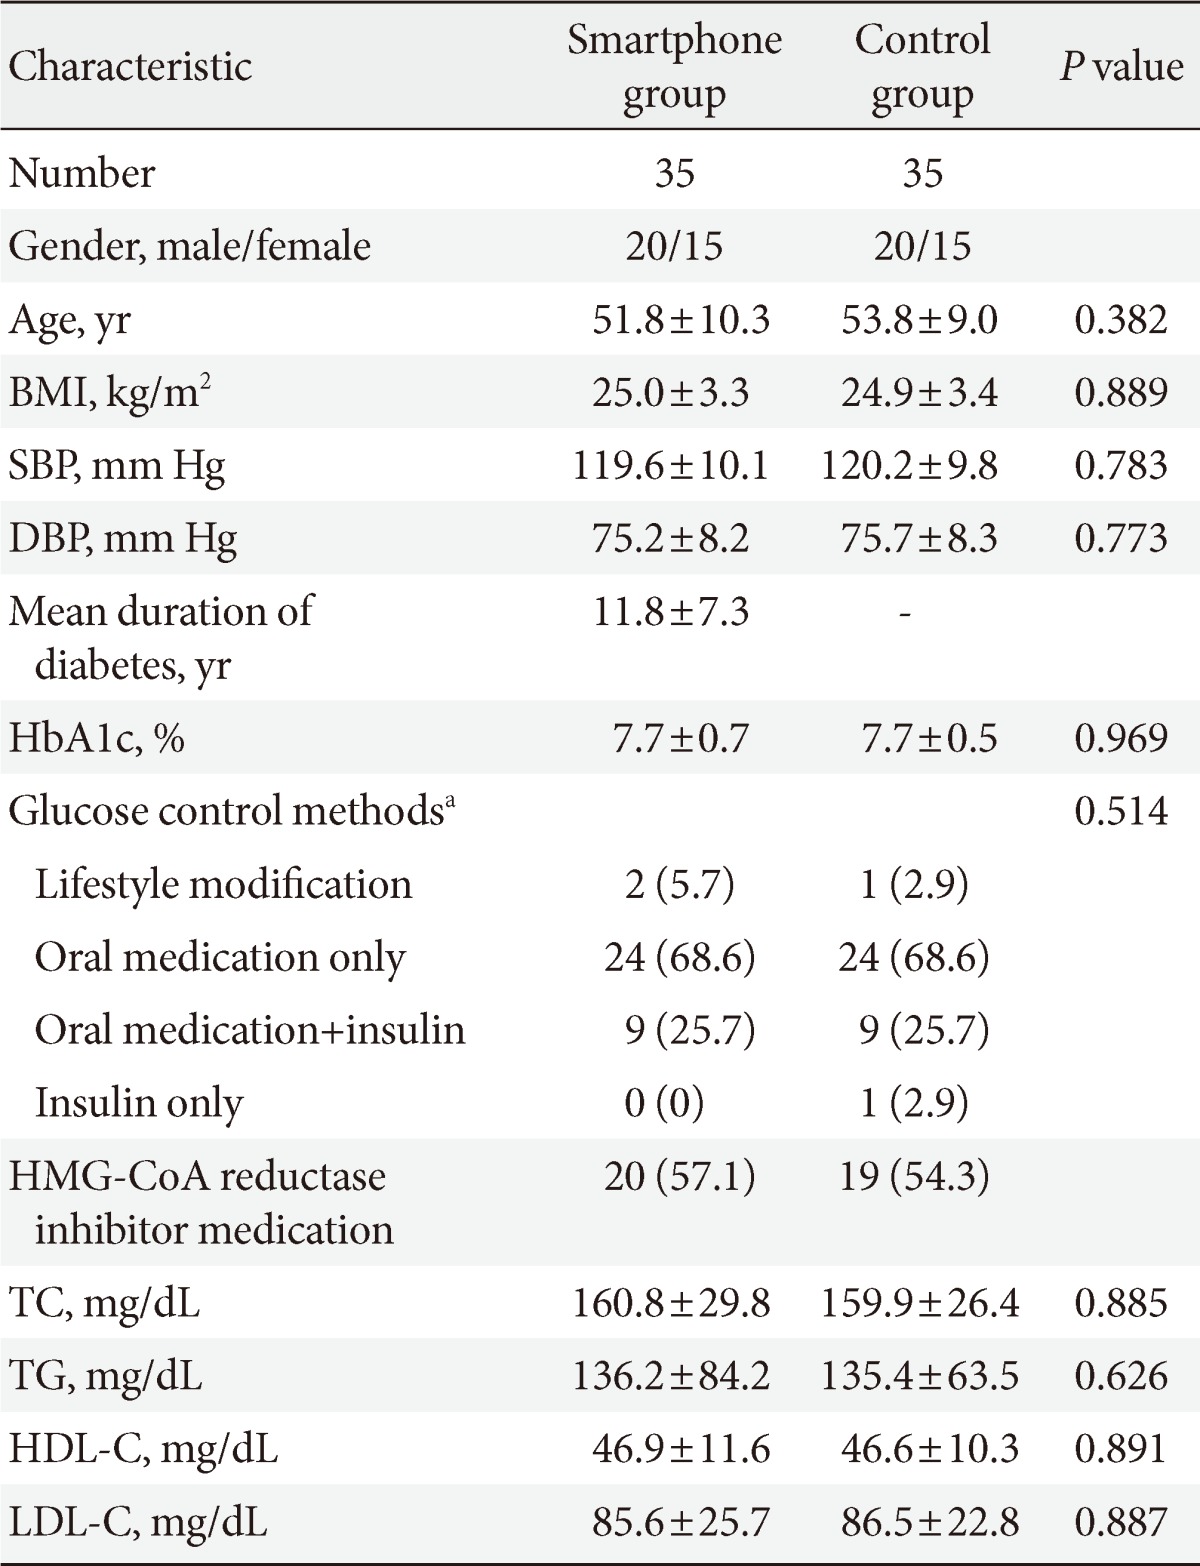
Table 1.
Clinical characteristics and baseline laboratory data of the Smartphone group and control groups

Values are presented as mean±standard deviation or number (%).
BMI, body mass index; SBP, systolic blood pressure; DBP, diastolic blood pressure; HbA1c, glycated hemoglobin; HMG-CoA, 3-hydroxy-3-methylglutaryl-CoA; TC, total cholesterol; TG, triglyceride; HDL-C, high density lipoprotein cholesterol; LDL-C, low density lipoprotein cholesterol.
aBased on Mantel-Haenszel chi-square test.
