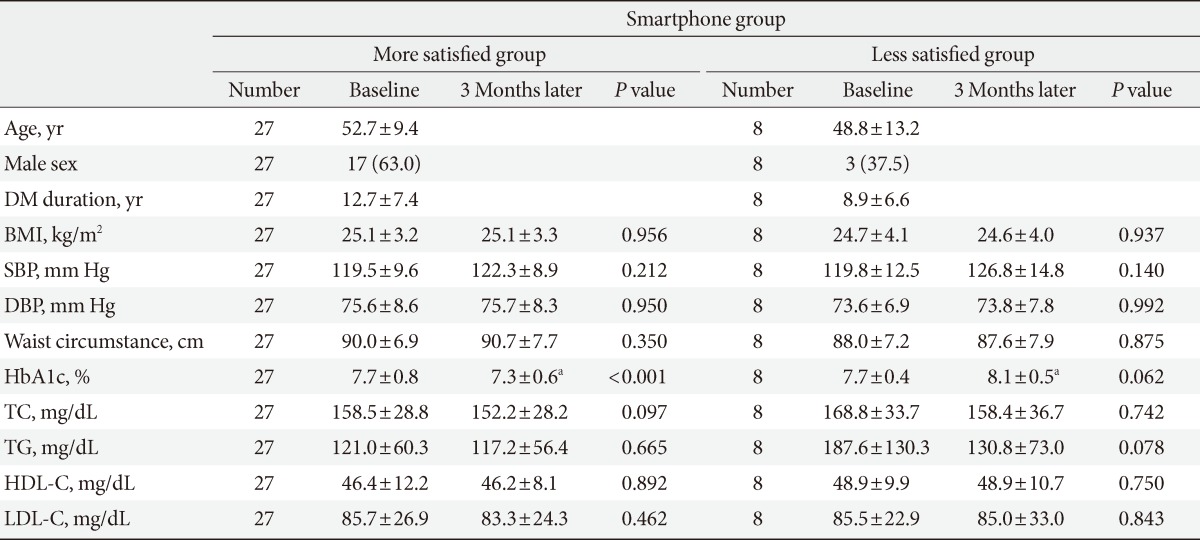
Table 4.
Laboratory follow-up data by satisfaction of patients

Values are presented as mean±standard deviation or number (%).
DM, diabetes mellitus; BMI, body mass index; SBP, systolic blood pressure; DBP, diastolic blood pressure; HbA1c, glycated hemoglobin; TC, total cholesterol; TG, triglyceride; HDL-C, high density lipoprotein cholesterol; LDL-C, low density lipoprotein cholesterol.
aStatistical significance was noticed (P<0.05) for the more satisfied group vs. the less satisfied group at 3 months later.
