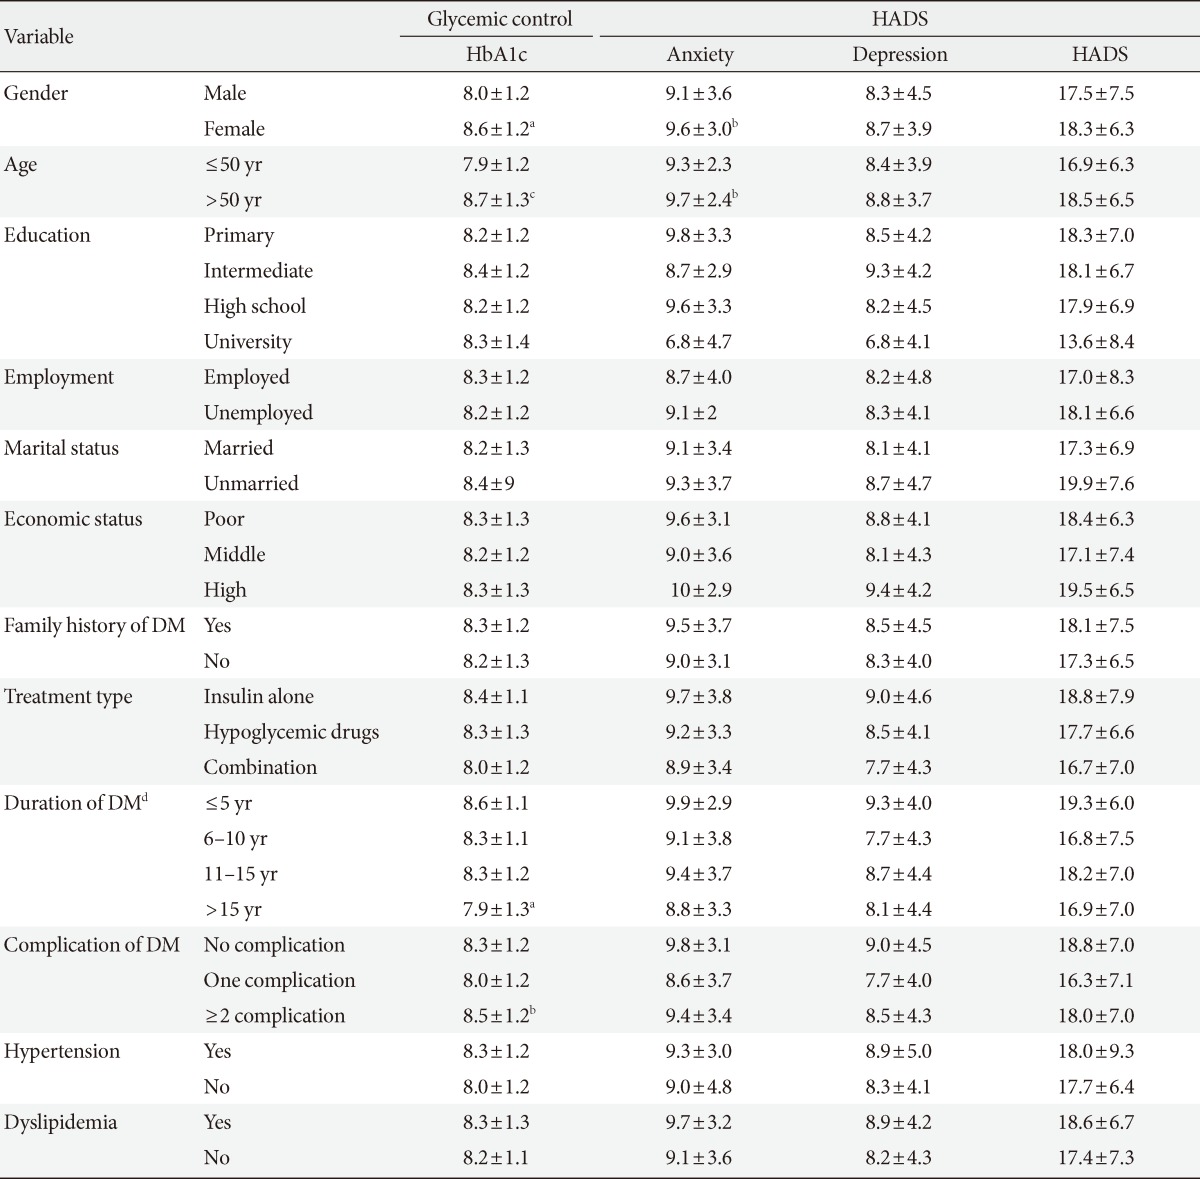
Table 2.
Glycemic control, anxiety, and depression differences in the study population

Values are presented as mean±standard deviation (t-test, one way analysis of variance, and Tukey post hoc test).
HADS, hospital anxiety and depression scale; HbA1c, glycosylated hemoglobin; DM, diabetes mellitus.
aP<0.01, bP<0.05, cP<0.001, d≤5 years vs.>15 years.
