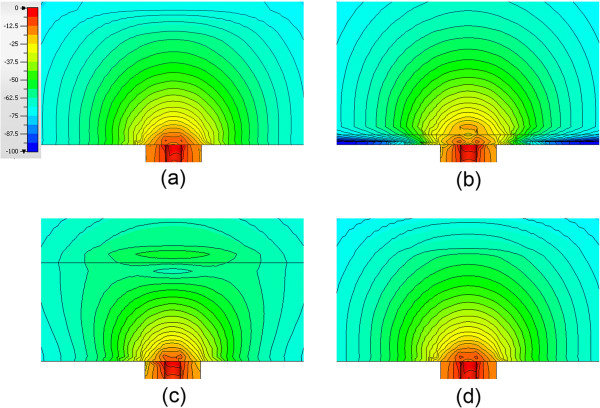
Figure 7.

Plots of the simulated amplitude field patterns for four different positions of the Teflon position in the water. (a) Directly against the probe (b) positioned 0.3 mm from the probe (c) positioned 3.0 mm from the probe (d) submerged purely in water.
