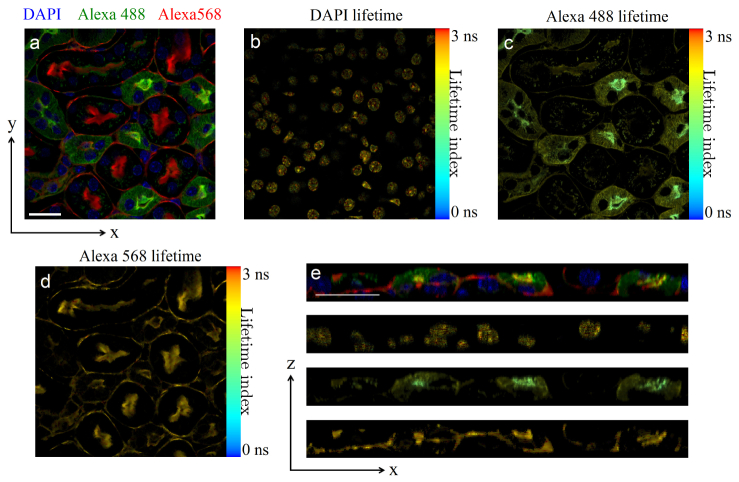
Fig. 3.
3D confocal lifetime image of triple-labeled mouse kidney slice. (a) False color intensity image of an x-y plane slice. (b) Lifetime x-y slice image of DAPI. (c) Lifetime x-y slice image of Alexa488 WGA. (d) Lifetime x-y slice image of Alexa568 phalloidin. (e) Sample x-z section. Top row: false color intensity image, showing co-localization of Alexa488 WGA and Alexa568 phalloidin at the basal area of proximal tubules. 2nd row: lifetime image of DAPI. 3rd row: lifetime image of Alexa488 WGA, showing decreased lifetime in the basal area of proximal tubules due to FRET between Alexa488 and Alexa568. Bottom row: lifetime image of Alexa568 phalloidin. The image size is 800-by-800 pixels with 0.15 μm pixel size, acquired at the full 44,000 pixel/s speed and processed without average. The full 3D data set is shown in Media 1 (2.1MB, MP4) . Scale bar 20 μm.

