Fig. 6.
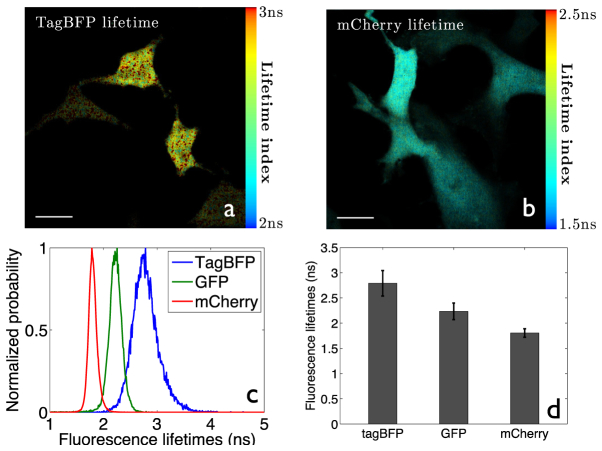
Lifetime images of HeLa cells expressing fluorescence proteins of blue and red colors. (a) TagBFP, 50 μW 405 nm excitation, 457 ± 20 nm emission. The excitation power and lifetime accuracy are lower because TagBFP is less photostable than GFP and mCherry; (b) mCherry, 200 μW 561 nm excitation, 593 ± 20 nm emission; (c) Lifetime histograms of three FPs; (d) Bar chart showing lifetime accuracy of three FPs. TagBFP: 2.79 ± 0.25 ns; GFP: 2.25 ± 0.16 ns; mCherry 1.80 ± 0.09 ns. All lifetimes match with literature values [35–37]. All images were acquired at the full 44,000 pixel/s speed. Lifetimes were fitted from data smoothed by a 2-by-2 pixel wide Gaussian window. The intensity images were processed at the original resolution. Scale bar 20 μm.

