Fig. 4.
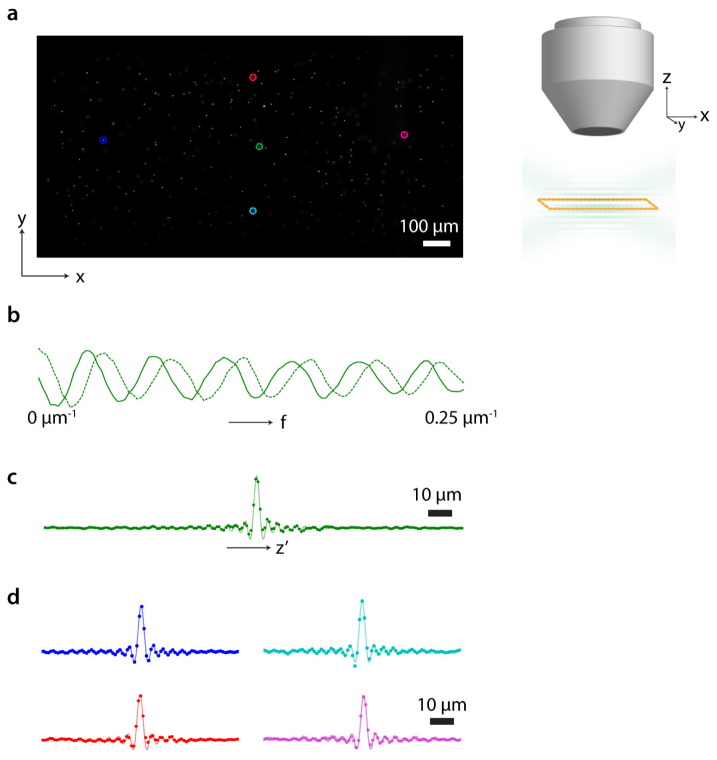
Quantifying axial resolution: a: Fluorescence image of 1 µm beads (0.8 mm x 1.6 mm). b: Real (solid) and imaginary (dotted) component calculated from the fluorescence signal (a.u.) of a bead (green circle in a) as the spatial frequency of illumination is swept from 0 to 0.25 µm-1. c: Fourier-transform of the signal in b, resulting in the axial profile of the bead with a point-spread function approximated by a sinc-function (fit). d: calculated axial profiles for the remaining indicated beads in a, illustrating the uniformity of illumination across a large field-of-view.

