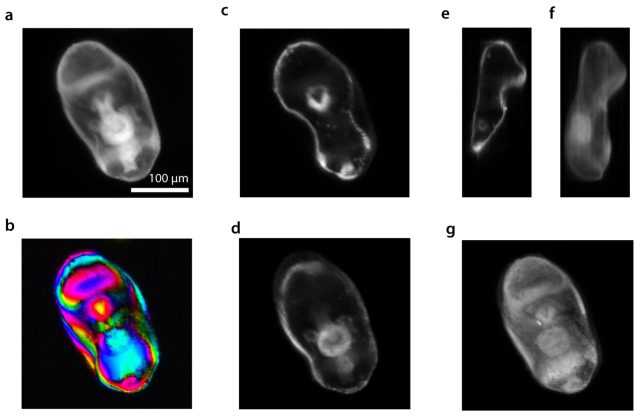
Fig. 5.
Imaging a starfish embryo: a: Fluorescence image of a starfish embryo. b: complex-valued image (C(x,y,f) in Eq. (1)) obtained for one of the illumination spatial frequencies. The color of each pixel indicates the measured phase, the luminance the amplitude. c and d: starfish z-sections obtained by FFT using SWIF. e: side view of the same data set. f: projection along the X-axis. g: 3D rendering.

