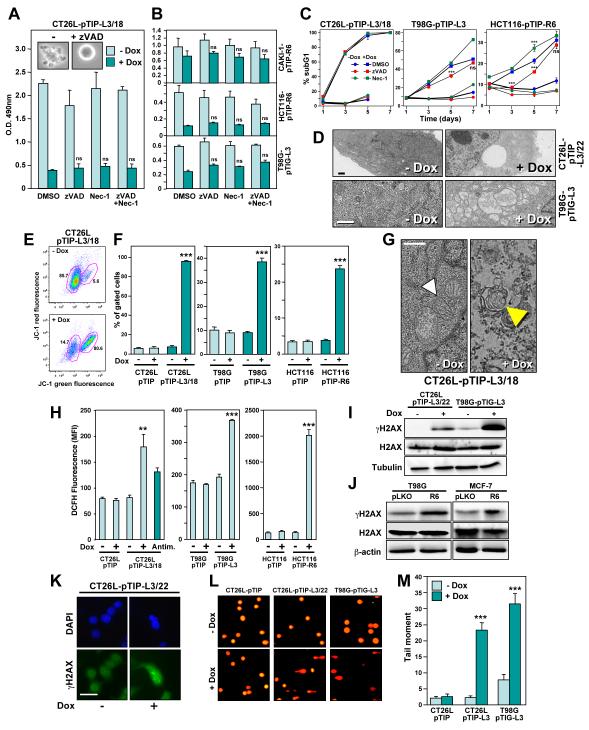
Figure 3. DICE Represents a Form of Necrosis Independent of RIP1 that Leads to Mitochondrial ROS Production and DNA Double Strand Breaks.
(A) CT26L-pTIP-L3/18 cells or (B) CAKI-1-pTIP-R6, HCT116-pTIP-R6, or T98G-pTIG-L3 cells were incubated with or without Dox after pretreatment with 20 μM zVAD-fmk, 20 μM Necrostatin-1, a combination of both inhibitors, or DMSO for 4 days (CT26L cells) or 5 days (other three cell lines). Cell survival was quantified by MTS assay.
(C) DNA fragmentation quantified in the indicated cells after treatment with Dox for up to 7 days in the presence of either zVAD-fmk (20 μM in CT26L and T98G, 10 μM in HCT116 cells) or Necrostatin-1 (20 μM in T98G, 10 μM in CT26L and HCT116 cells). The day 7 data points for CT26L cells are not shown because cells started to die due to overconfluency. P-values were calculated by ANOVA.
(D) Transmission electron micrographs of CT26L-pTIP-L3/22 and T98G-pTIG-L3 cells 4 days after incubation with or without Dox. Size bars, 1 μm.
(E) Representative FACS plot of CT26L-pTIP-L3/18 cells after incubation with and without Dox for 3 days after staining the cells with JC-1. Left gate: Intact cells, right gate: cells with loss of mitochondrial transmembrane membrane potential.
(F) Events (percent) in right gate of the indicated cell lines treated as in (E) for 3 days (CT26L) or 4 days (T98G, HCT116) (data are mean ± s.d.). P-values were calculated by ANOVA.
(G) Electron micrographs of CT26L-pTIP-L3/18 cells treated or not with Dox for 3 days. White arrow head, intact mitochondrion; yellow arrow head, onion shaped structure found instead of mitochondria. Size bar, 500 nm.
(H) Quantification of ROS production by DCFH fluorescence in cells treated with or without Dox for 2 days (CT26L), 4 days (T98G), 5 days (HCT116), or CT26L cells treated with antimycin for 24 hours. P-values were calculated by ANOVA.
(I, J) Western blot analysis for γH2AX and H2AX in CT26L-pTIP-L3/22 and T98G-pTIG-L3 cells, 2 days and 4 days after Dox treatment, respectively (I). T98G and MCF-7 cells were infected with pLKO control virus or pLKO-R6 (J), and Western blot analysis was performed after 5 days.
(K) Immunofluorescence microscopy of CT26L-pTIP-L3/22 cells treated or not with Dox for 2 days. Cells were fixed with paraformaldehyde and stained for γH2AX (green) and DAPI (blue). Scale bar = 100 μm.
(L) CT26L-pTIP, CT26L-pTIP-L3/22 (2 days Dox), and T98G-pTIG-L3 (4 days Dox) cells were subjected to an alkaline comet assay. Representative fluorescence photomicrographs of comet assay showing DNA migration pattern in single cell gel electrophoresis stained with SYBRGreen-1.
(M) Quantification of tail moment of cells in (L) expressed in arbitrary units. Values represent the average of all cells within a given sample population. P-values were calculated using t-test.
** = p<0.001; *** = p<0.0001; ns = not significant.

