Figure 4.
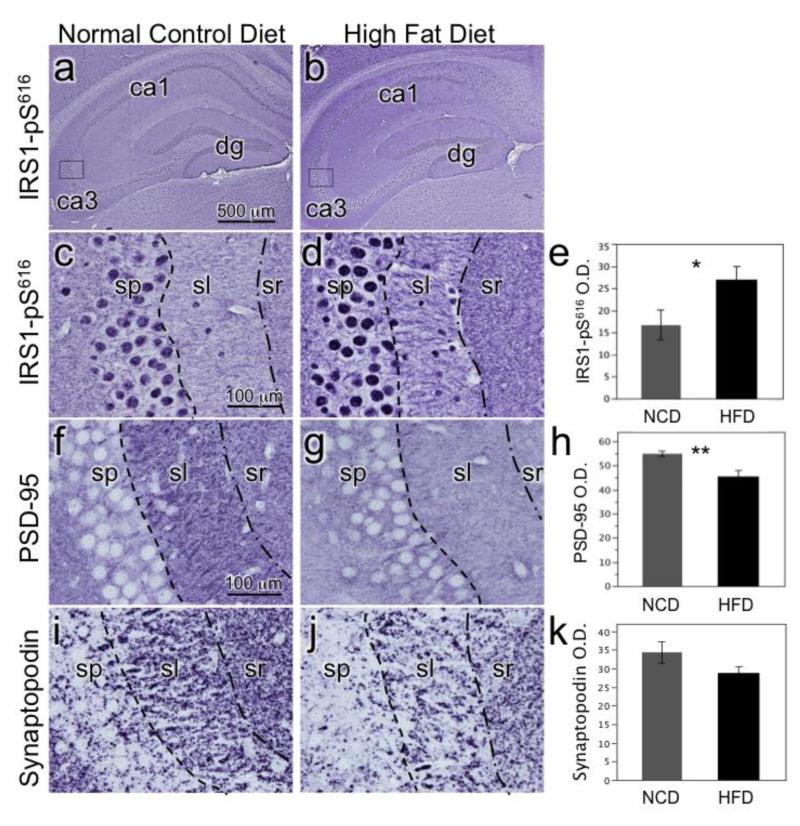
Chronic moderate HFD effects on hippocampal CA3 molecular neuroanatomy. Photomicrographs are from mice fed a 45% fat calorie HFD or NCD for 8 weeks. A) Low magnification image of NCD mouse hippocampus labeled for IRS1-pS616 with box indicating location in CA3 where higher power images in C was taken. B) Low magnification image of 45% HFD mouse with box for image in D. C) NCD mouse CA3 labeled for IRS1-pS61 shows typical nuclear staining in stratum pyramidale (sp) and weak labeling of stratum lucidum (sl) and stratum radiatum (sr). D) 45% HFD mouse labeled for IRS1-pS616 shows increased overall labeling and distinctly labeled dendrites. E) Bar graph depicts mean optical density (O.D.) values (+SEM) of sl in NCD and 45% HFD mice (*p<0.05). F) NCD mouse CA3 labeled for PSD-95, an important scaffolding protein for post-synaptic densities. G) 45% HFD mouse CA3 shows decreased PSD-95 immunolabeling in sl. H) Graph depicting decreased PSD-95 expression in sl of HFD mice (**p<0.005). I) NCD mouse CA3 labeled for synaptopodin, an actin-associated protein essential for the formation of spine apparatuses in spines. Note its punctate appearance denoting spines. J) 45% HFD mouse CA3 shows decreased density of synaptopodin puncta in sl. K) Graph portrays decreased synaptopodin spine density in HFD mice (p<0.1).

