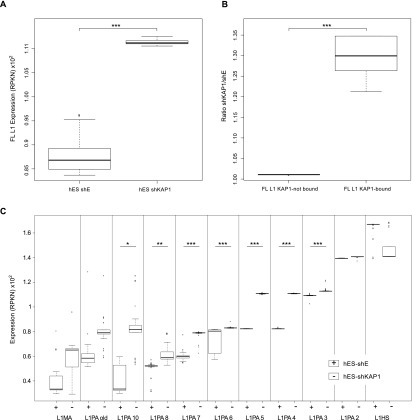
Figure 4.
KAP1 depletion leads to up-regulation of KB L1 in hES cells. (A) Comparative expression of full-length L1 elements in hES cells transduced with control (shE) or Kap1 knockdown (shKAP1) lentiviral vectors. (B) Relative change in the expression of full-length L1 elements bound or not by KAP1, comparing Kap1 knockdown and control hES cells. (C) Comparative expression of full-length L1 in control versus Kap1 knockdown hES cells, examining each L1 subfamily separately, arranged from the oldest to the youngest one. The “L1MA” category corresponds to the families L1MA1 to L1MA9. The “L1PA old” category corresponds to the families L1PA11 to L1PA17. The raw data have been bootstrapped 1000 times for the plot design. Expression corresponds to RPKN values (see the Material and Methods), with P-values ([*] P ≤ 0.05; [**] P ≤ 0.01; [***] P ≤ 0.001) calculated on the raw data by Wilcoxon nonparametric test.

