Figure 3.
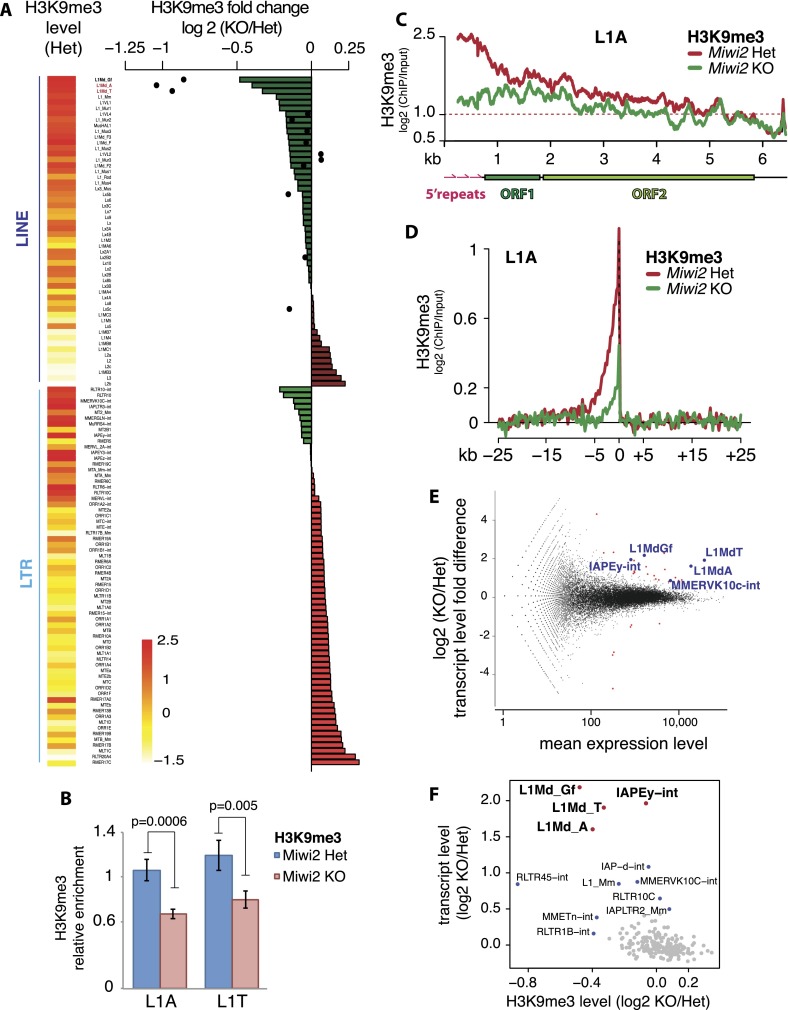
Effect of Miwi2 mutation on the H3K9me3 mark and TE expression in spermatogonia. (A) Differences in H3K9me3 levels over LINE and LTR families in spermatogonia of 10-dpp Miwi2 knockout (KO) animals relative to those in their heterozygous littermates. Levels of H3K9me3 on 5′ repeats of selected LINEs are displayed as black dots. Heat map shows H3K9me3 levels in LINE and LTR families in germ cells from Miwi2 heterozygous animals; the scale bar at the bottom shows the log2 (ChIP/input) values of these levels. Two L1 families, L1-A and L1-T, analyzed by independent ChIP-qPCR experiments shown on B, are marked in red. (B) ChIP-qPCR on L1-T and L1-A elements confirms a decrease in the H3K9me3 mark in spermatogonia of Miwi2 knockout animals. Spermatogonia were sorted from testes of 10-dpp animals by MACS using the EpCAM cell surface marker. The signal was normalized to respective ChIP input and internally normalized to signal over IAPLTR1a. Two independent ChIP experiments were performed, and error bars show standard deviation. P-values were calculated using t-test based on two sets of qPCR triplicates for each ChIP. (C) Distribution of the H3K9me3 mark along the consensus sequence of L1-A in spermatogonia of Miwi2 knockout and control animals. The Y-axis shows enrichment (log2) of H3K9me3 signal in ChIP-seq compared with input. Signals above the red dashed line indicate at least twofold enrichment. (D) Metaplot of the input-normalized level of the H3K9me3 mark in genomic regions flanking all L1-A insertions in spermatogonia of Miwi2 knockout and control animals. Only uniquely mapped reads were considered. Tandem L1-A genomic insertions were excluded from the analysis. (E) Differential expression of genes and TEs in testes of 10-dpp Miwi2 knockout and control animals as measured by RNA-seq. The fold change in expression upon Miwi2 knockout (Y-axis) is plotted against the average expression level (X-axis). Each dot corresponds to a gene or TE family. Genes (red) and TEs (blue) that passed the multiple testing-adjusted P-value < 0.01 threshold are shown. (F) Correlation between the changes in H3K9me3 and expression levels of TE families upon Miwi2 knockout. The X-axis shows the fold difference of H3K9me3 signal in TE families in spermatogonia of Miwi2 knockout and control animals (negative values indicate the loss of H3K9me3 signal in Miwi2 knockout animals). The Y-axis shows the fold difference in abundance of TE transcripts in Miwi2 knockout compared with control mice. LINE and LTR families with at least 5000 mapped reads were considered.

