
Figure 5.
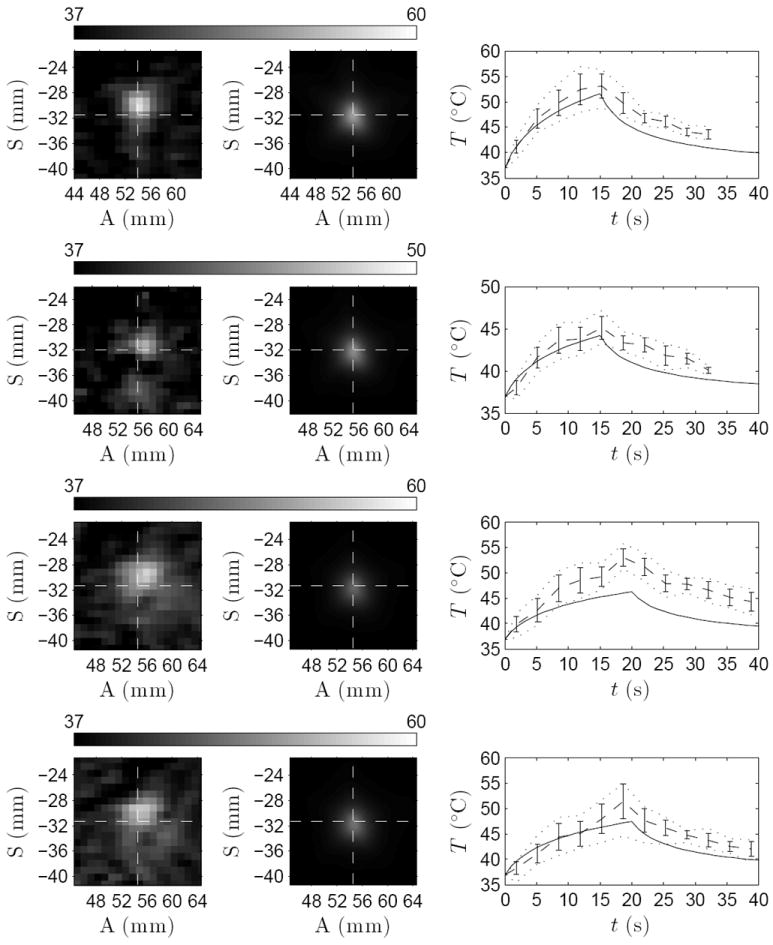
Left column: close-up of the measured thermal focus. Middle column: simulated temperature after spatial averaging over the MR-voxel volumes. The cross-section of dashed lines marks the prescribed target. Right column: temperature evolution for simulated (——), measured average (- - - -) with its standard deviation (vertical lines), and minimum and maximum temperatures (⋯⋯) in 3 × 3 voxel neighborhood centered at the peak temperature elevations. Data shown for sonications 1–4 from top to bottom in patient A.