
Figure 7.
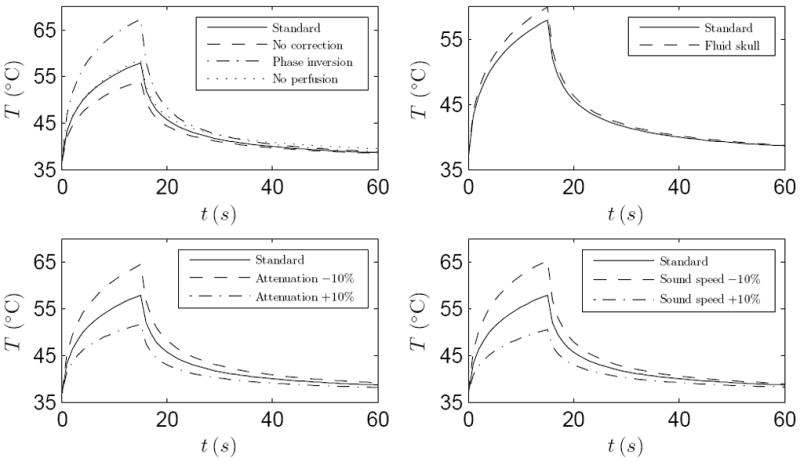
Focal temperatures with varied simulation parameters performed on the geometry and baseline parameters of patient A and sonication one. Shown in each figure is the baseline simulation with standard parameters (——). Top left: simulation with no phase correction (- - - -), simulation with phase inversion (— · —) and simulation with no blood perfusion (⋯⋯). Top right: simulation with skull modeled as fluid (- - - -). Bottom left: simulations with skull attenuation decreased (- - - -) and increased (— · —) by 10%. Bottom right: simulations with skull sound speed decreased (- - - -) and increased (— · —) by 10%.