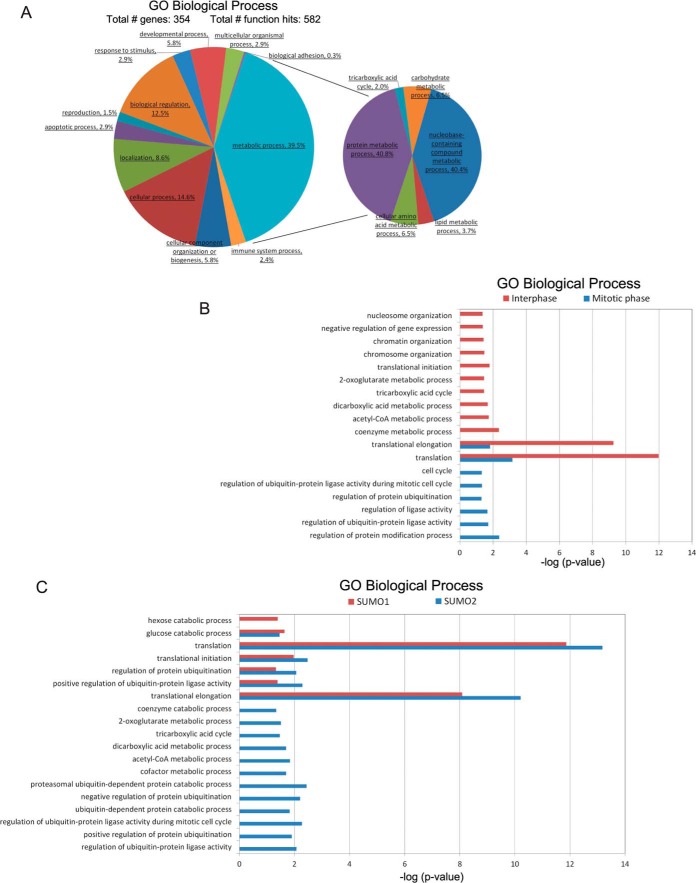
Fig. 5.
Functional analysis of SUMO substrates. A, Pie chart showing gene ontology analysis of the SUMO candidate proteins. The genes were grouped into categories defined by GO Biological Processes by the PANTHER classification system. The largest category is that containing gene products that play roles in metabolic process. B, Bar chart showing enrichment p values of SUMO substrates identified from interphase or mitotic phase for GO Biological Process terms generated by DAVID database. C, Bar chart showing enrichment p values of SUMO1 and SUMO2 substrates for GO Biological Process terms generated by DAVID database.

