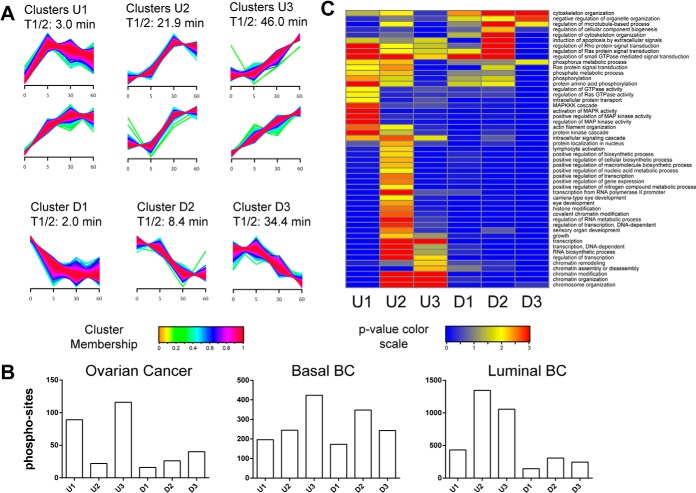
Fig. 3.
Temporal dynamics of phosphorylation changes resulting from cold ischemia. A, fuzzy c-means clustering of temporal profiles for all regulated phosphosites observed in the ovarian and breast cancer samples. We detected six up-regulated (U) clusters, which were further grouped pairwise into early (U1), middle (U2), and late clusters (U3), and three down-regulated (D1, D2, D3) clusters using a fuzzyfication parameter m = 1.6. Phosphosites were assigned to each cluster with a membership value α > 0.7. T1/2 indicates the median over all half-maximum time points for all phosphosites within a cluster. Half-maximum time points were determined via first-order kinetic modeling analysis. B, number of regulated phosphosites assigned to each cluster for the ovarian and breast cancer tumors. C, gene enrichment analysis of regulated human phosphoproteins across early, middle, and late clusters. We used DAVID Bioinformatics Resources 6.7 (39) to test for enrichment of GO BPs in each cluster relative to a list of all proteins containing nonregulated sites using a modified Fisher's exact test (EASE score). GO BP categories with p < 0.01 and a minimum occurrence of ≥10 genes/proteins were called significant. p values were −Log10 transformed, and the transformed values for each annotation were plotted as a heat map in Gene-E.

