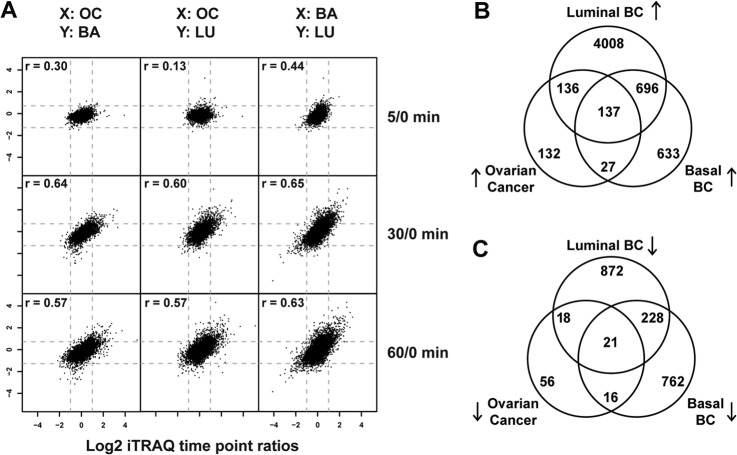
Fig. 4.
Ischemia induced common phosphorylation events in ovarian and basal-like/luminal breast cancer tumor samples. A, scatter plots of averaged phosphosite ratios (5:0, 30:0, and 60:0) over at least three ovarian tumors (OC) and at least two basal-like (BA) or luminal (LU) breast cancer samples. X and Y indicate which tumor type is plotted on the respective axis. Intertumor Pearson correlation coefficients are indicated for each tumor type comparison. B, C, Venn diagrams of the overlap of up-regulated (B) and down-regulated (C) phosphosites between ovarian and basal-like/luminal breast cancer samples.

