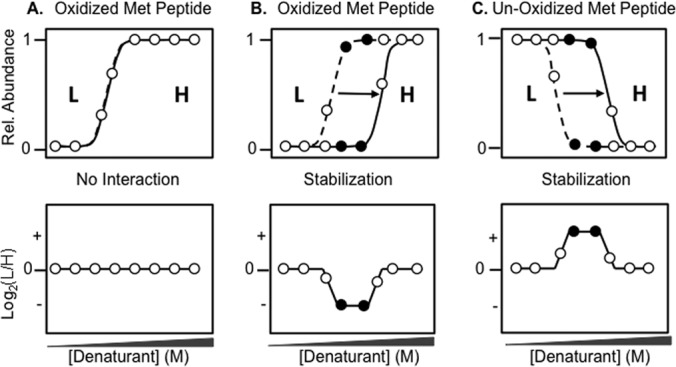
Fig. 2.

Schematic representation of SILAC-SPROX data expected for methionine-containing peptides in a SILAC-SPROX experiment in which the test ligand is spiked into the heavy lysate. Shown is the expected SPROX data (top panels) and the corresponding SILAC-SPROX data (bottom panels) for an oxidized methionine-containing peptide derived from a protein that does not interact with the ligand, A, for an oxidized interact-containing peptide derived from a protein that is stabilized in the presence of the ligand, B, and for a nonoxidized methionine-containing peptide derived from a protein that is stabilized in the presence of ligand, C, The SPROX curves represented with the dotted and solid lines in the top panels indicate those expected for a protein in the light and heavy lysate (respectively). Open circles represent data points at denaturant concentrations where the L/H ratio is unchanged in SILAC-SPROX. Closed circles represent data points at denaturant concentrations where the L/H ratio is indicative of a peptide (protein) hit. SILAC-SPROX data generated from ligand-induced destabilizations would be similar to that shown, except the sign of the altered Log2(L/H) ratios would be opposite from that shown in each case.
