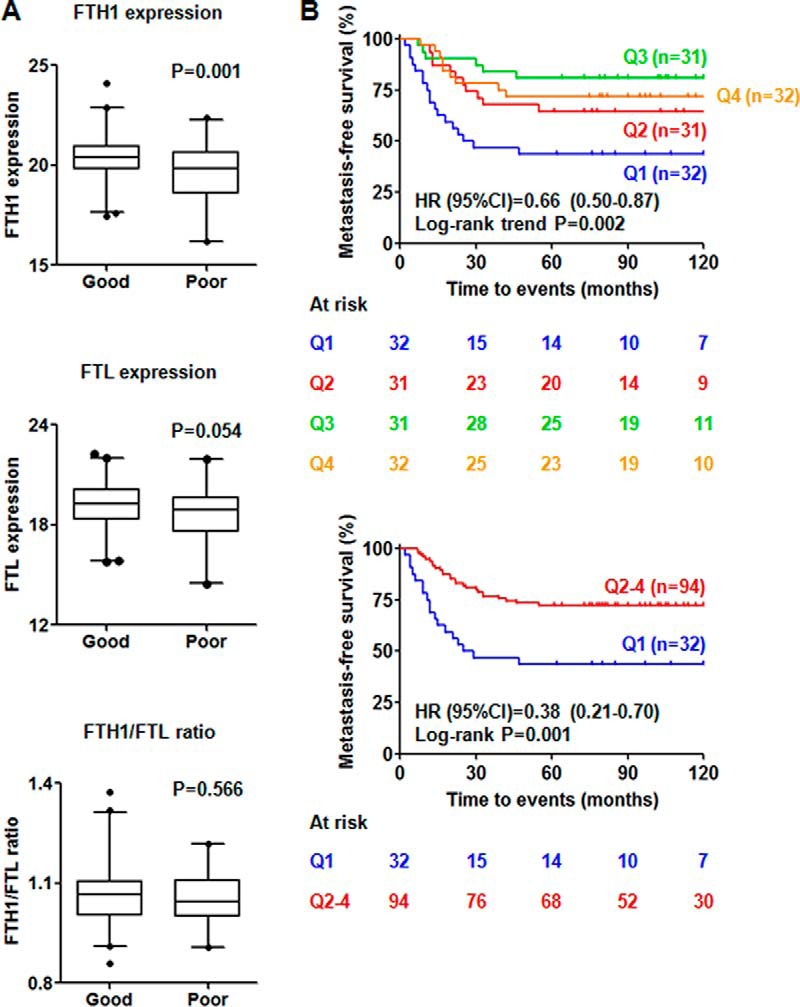
Fig. 1.

Prognostic values of FTH1, FTL, and FTH1/FTL ratio in the MS data set of 126 TNBC tumors. A, Expression of FTH1 is significantly higher in good (n = 82) prognostic TNBC patients, but there is no significant difference in expression of FTL and FTH1/FTL ratio between the two groups of patients; B, Expression of FTH1 significantly correlates to metastasis-free survival in Kaplan-Meier survival analyses (Q1- Q4 = first, second, third and fourth quartile. HR = hazard ratio, CI = confidence interval).
