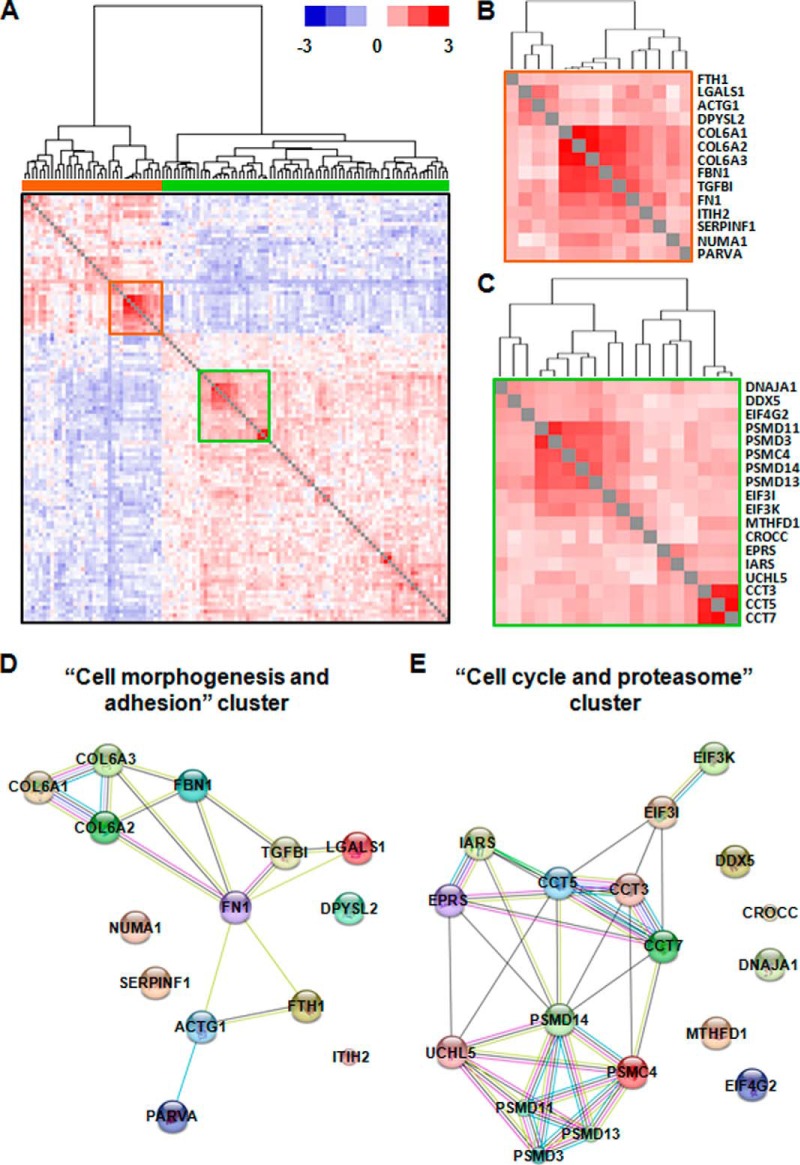
Fig. 6.
Over-represented network from all the proteins correlated with FTH1 expression. A, A hierarchical cluster of proteins significantly correlating with FTH1 expression forms two distinct clusters, representing to those which show positive (orange bar) and negative (green bar) correlation. The red and green squares highlight two highly correlated subclusters; B, The red subcluster positively correlates with FTH1 expression; C, The green subcluster negatively correlates with FTH1 expression; D, The protein interaction map from the red subcluster is associated with biological process of “cell morphogenesis and adhesion”; E, The protein interaction map from the green subcluster is associated with the biological process of “cell cycle and proteasome.”

