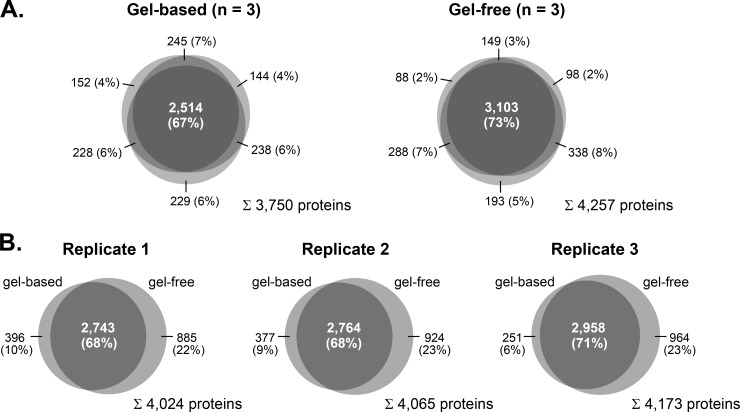
Fig. 2.
Venn diagrams showing the intersections of protein identifications from mouse olfactory cilia membranes. A, overlap of protein identifications (i.e. MaxQuant protein groups) obtained from three independent replicates by gel-based (left) and gel-free (right) proteomics analysis. B, comparison of protein identifications obtained by gel-based and gel-free analyses.

