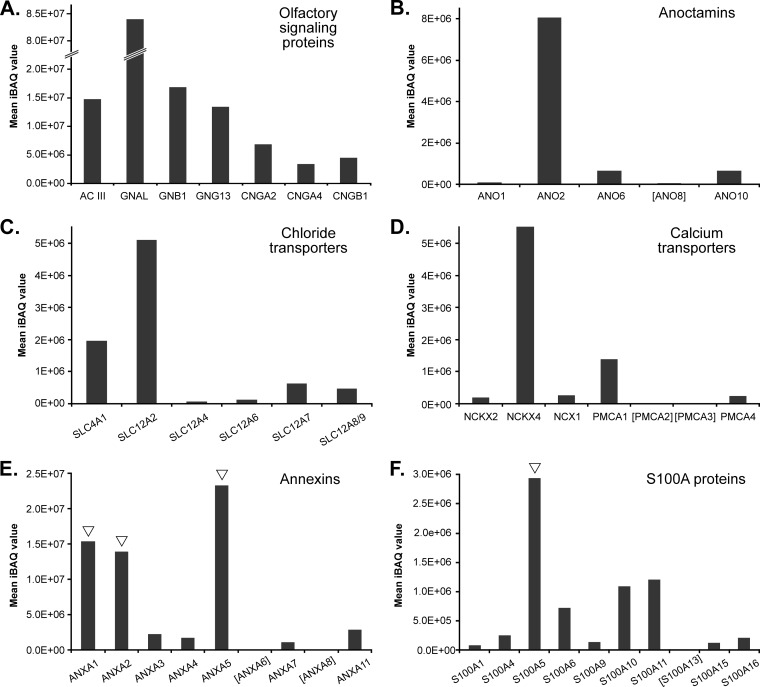
Fig. 5.
Relative abundance of proteins with known and putative function in olfactory signaling. Olfactory signaling proteins (A), anoctamins (B), chloride and calcium transporters (C and D), annexins (E), and S100A proteins (F) detected in olfactory cilia membrane fractions are plotted against their mean iBAQ value determined across all replicates. ▿, new components of olfactory cilia validated in this work. Mean iBAQ values of proteins in square brackets were in the range of 2.82E + 03 to 9.03E + 04.

