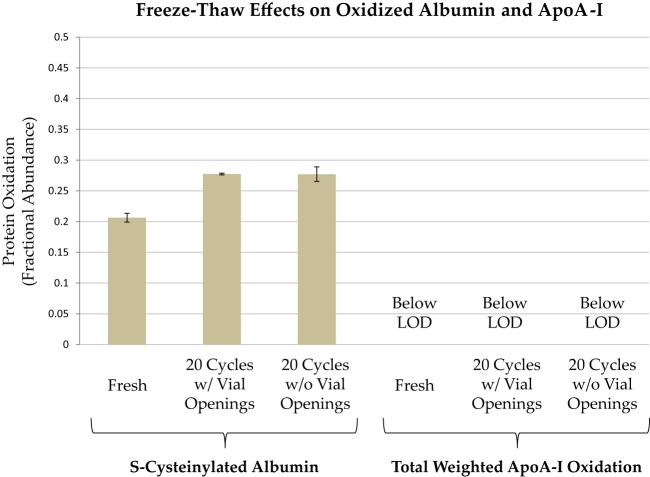
Fig. 4.
Freeze–thaw cycle effects on albumin and apoA-I oxidation. Following initial analysis (n = 6), a fresh sample was split into two vials, each of which was subjected to 20 freeze–thaw cycles prior to analysis in triplicate (average ± S.E. shown). One vial was opened at each thaw cycle, and the other vial was not opened until 20 freeze–thaw cycles were complete. For S-cysteinylated albumin, the differences between the fresh sample and the freeze–thaw cycled samples were significant (Mann–Whitney U test, p < 0.05) but in accord with a total thawed time of about 300 min (see Fig. 2).

