
Fig. 2.
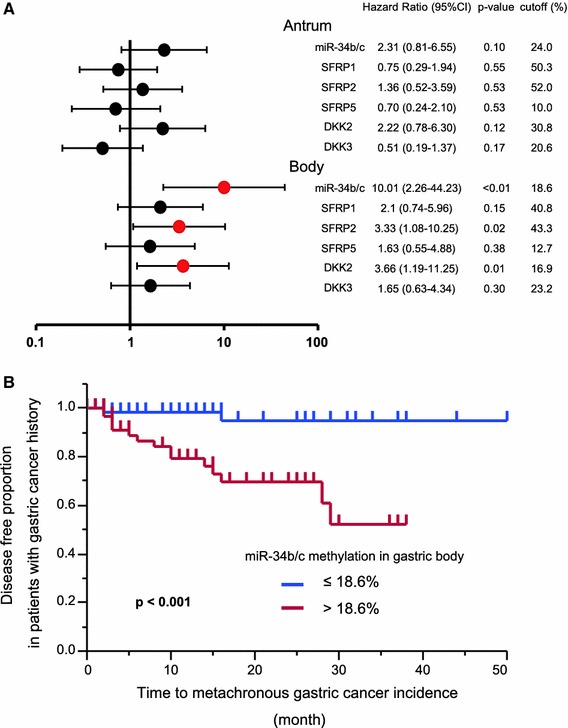
Associations between DNA methylation and metachronous GC risk. a Forest plot showing hazard ratios (closed circles) for developing metachronous GC and 95 % confidence intervals (bar lines). Univariate Cox proportional hazards model analysis was performed to assess the correlations between methylation of the six indicated genes and the incidence of metachronous GC. b Kaplan–Meier analysis of the effect of miR-34b/c methylation in the gastric body on metachronous GC-free survival (n = 129)