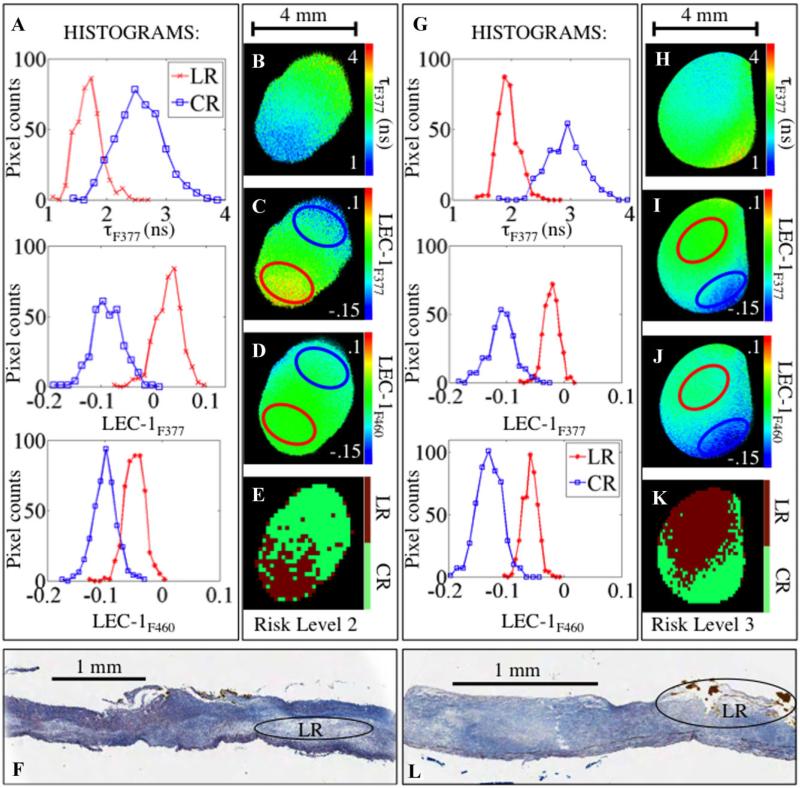
Fig. 2.
A and G: Histograms from images in (B–D), and (H–J), respectively. B and H: tF377. C. and I: LEC-1F377. D and J: LEC-1F460. Blue circle: CR region, red circle: LR region. Histograms from pixels within these regions are plotted in (A) and (F). E and K: Classification of entire image. F and L: Trichrome stained tissue sections from FLIM data shown in (A–E) and (G–K), respectively. Lipid pools are seen in both images, circled and labeled “LR.”

