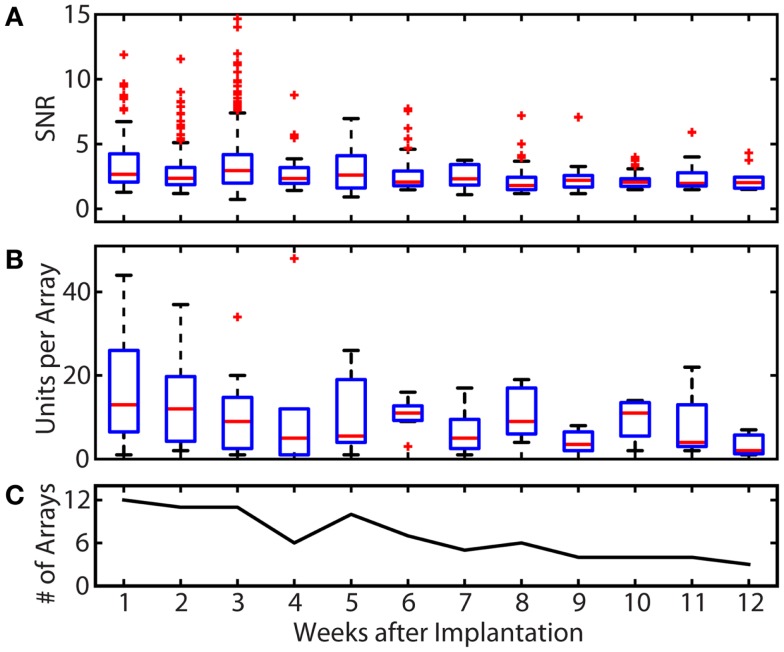
Figure 3.
Summary of recording quality and quantity for the duration of all implants. (A) Summary of the SNR of all units over time. The median SNR (shown by the red line) remained at 2 or higher over the lifetime of all implants. Some single unit recordings with very high SNR values were observed in the first 4 weeks post-implantation. (B) Summary of motor unit yields over time. Single unit yield was calculated using units with an SNR >1.2. The mean number of units per array was 17.3 in week 1 and remained between 10.5 and 13.5 through week 6. The total single unit yield decayed over the implant periods, resulting in a mean of 3.3 units per array at week 12. (C) Number of arrays recorded from per week. Because the total implant time in each animal and the number of recording session per week varied, only available arrays were included in unit yield and SNR calculations. These variations explain the increases in yield between weeks 5 and 6 (and other weeks), which reflects the elimination of failed implants from the pool of arrays being evaluated. In the boxplots of (A,B), the red line represents the median values, the upper and lower limits of the boxes represent the 75th and 25th percentiles, and the whiskers extend to cover approximately 99.3% of the data. Red “+” signs are data that fall outside of this range and are considered outliers.

